
Home » Posts tagged 'plus'
Tag Archives: plus
#HREE Harena Rare Earths PLC – Completion of Pre-Feasibility Study
 Harena Rare Earths Plc (LSE: HREE) (OTCQB: CRMNF), the rare earths company focused on the Ampasindava ionic clay rare earth project in Madagascar (the “Ampasindava Project“), is pleased to announce the highlights from its completed pre-feasibility study (“PFS“). The PFS represents an important advancement in the development of the Ampasindava Project, confirming its technical viability and providing a robust economic and operational framework to support the next phase of project progression.
The PFS was compiled by the Company with leading global engineering group SGS engaged to support technical inputs to the PFS and also to conduct an update of the 2023 Mineral Resource Estimate to JORC 2012 standard.
PFS HIGHLIGHTS
Robust technical and economic viability for long life heap leach operation
|
• |
Total rare earth oxide (TREO1) of ~71kt, over a measured 20-year life of mine (LOM) |
|
|
• |
Plant throughput set at 5Mtpa (dry) at average grade at 1,500 ppm TREO supported by independent metallurgical test work |
|
|
• |
Pre-production capital cost estimate of US$142 million, including 25% in EPCM (engineering, procurement and construction management) and funding costs |
|
|
• |
Annual TREO production estimate of 4,000 tonnes per year |
|
|
|
° |
Annual oxide (NdPr + DyTb) production of 1,700t per year (29,670t for 20 years) |
|
° |
Ratio of magnetic rare earth oxide (Magnet REO2) yielded to TREO despatched at 41% |
|
Excellent economic returns modelled using analyst sourced long term pricing
|
• |
Undiscounted LOM free cashflow of US$1.0 billion post-tax |
|
• |
Pre Tax NPV10 of US$343.7 million |
|
• |
Pre Tax IRR of 34% |
|
• |
Post Tax NPV10 of US$249.6 million |
|
• |
Post Tax IRR of 30% |
|
• |
Payback period of 4 years |
Outstanding financial metrics based on current publicly sourced consensus rare earth pricing
|
• |
Undiscounted LOM free cashflow of US$2.6 billion post-tax |
|
• |
Pre Tax NPV10 of US$616.1 million |
|
• |
Pre Tax IRR of 30% (Consensus pricing more optimistic in later years) |
|
• |
Post Tax NPV10 of US$464.3 million |
|
• |
Post Tax IRR of 27% |
|
• |
Payback period of 5 years |
Economic outcome summary
The Company has modelled the Ampasindava Project’s economics using two sets of rare earth oxide price forecasts. The base case uses a price deck sourced from a recognised Minerals Analyst for the years between 2025 and 2044. The Consensus Price deck is sourced using artificial intelligence (AI) applications that scrape web information on publicly available REO pricing forecasts between 2030 and 2049. In addition, the Company has modelled a situation, called Ampas Plus, using the base case price deck with a 10% reduction in opex and capex applied throughout.
|
Pre Tax 20 Yr NPV10 and IRR |
NPV10 |
IRR |
Payback |
|
|||
|
Base Case using Long-term Analyst Prices |
USD 349 m |
34% |
4 Yrs |
|
|||
|
Base Case using Current AI Consensus Prices |
USD 616 m |
30% |
5 Yrs* |
|
|||
|
Ampas Plus – Opex and Capex Savings |
USD 439 m |
41% |
3 Yrs |
|
|||
|
|
|||||||
|
Post Tax 20 Yr NPV10 and IRR |
NPV10 |
IRR |
Payback |
||||
|
Base Case using Analyst Prices |
USD 249 m |
30% |
3 Yrs |
||||
|
Artificial Intelligence Consensus Prices |
USD 464 m |
27% |
6 Yrs* |
||||
|
Ampas Plus – Opex and Capex Savings |
USD 327 m |
36% |
3 Yrs |
||||
* Consensus pricing more optimistic in later years
1. All references to Oxides are based on the contained level of those Oxides within the MREC product, noting the TREO contains La2O3 + CeO2 +Pr6O11 + Nd2O3 + Sm2O3 + Eu2O3 + Gd2O3 + Tb4O7 + Dy2O3 + Ho2O3 + Er2O3 + Tm2O3 + Yb2O3 + Lu2O3 + Y2O3
2. Magnetic Rare Earth Oxides (Magnetic REO) = Pr6O11 + Nd2O3 + Tb4O7 + Dy2O3
20 Year Prices forecast sourced from AI tools scraping web information on REO pricing forecasts
Ampasindava Project rapidly advancing and progressively de-risked
|
• |
Planning for a phased “Proof of Concept” plant at site is underway: |
|
|
|
° |
Initial establishment of a permanent on-site laboratory |
|
|
° |
Establishment of on-site test cribs and columns |
|
|
° |
Opportunity to optimise flowsheet and test downstream rare earth separation at a pilot scale |
|
• |
Selection of specialists to compile DFS and upgrade PFS to reduce cost and process risk |
|
|
• |
Commence targeted cost reduction and optimisation initiatives including: |
|
|
|
° |
Selection of high-grade zones for initial inclusion in mine plan |
|
|
° |
Optimising supply chain options |
Strong national government support
|
• |
Strong engagement with Malagasy national and regional governments |
|
• |
Environmental and social studies continue to support permitting and local validation |
|
• |
Permitting on track to allow construction to commence in 2027 |
|
• |
Social programs will focus on suitable and appropriate land compensation, job creation, education of youth, individual technical skills development, and local business creation and readiness |
Allan Mulligan, Executive Technical Director of Harena, said:
“The completion of the PFS represents a significant step forward for Harena and the Ampasindava Project. With significant previous investment in resource development, process testwork and environmental programs, we have an excellent understanding of the Ampasindava Project where we can now further optimise the asset as we move into the final piloting and studies phase.
The Ampasindava Project hosts a world-class scale ionic absorption rare earths mineralisation, particularly amenable to low cost and high yield recoveries. The sustainable and rapid remediation heap leach extraction model will serve to enhance the local, regional and national economy with no lasting impacts on the environment.
Our confidence in the results of the PFS and the underlying PFS process more broadly is based on the enormous previous works and current understanding of the orebody, and the inclusion of the Proof-of-Concept plant in 2026 will allow a smooth and organised mobilisation into construction with reduced start up risk.”
Ivan Murphy, Executive Chairman of Harena, said:
“We are extremely pleased to be releasing the excellent results of this pre-feasibility study to the market. The key metrics presented here clearly highlight the exceptional scale, quality and strategic significance of the Ampasindava Project, reinforcing its position as a world-class heavy rare earth asset and marking a major milestone in its progression towards development.
I would like to sincerely thank Allan Mulligan, our Executive Technical Director, for his dedication over the recent months, as well as the wider internal and external teams whose expertise and commitment have been instrumental in delivering this important result.”
SUMMARY REPORT
Introduction
Harena Rare Earths Plc is pleased to present the Pre-Feasibility Study (“PFS“) outcomes for its Ampasindava Rare Earth Ionic Clay Project (the “Ampasindava Project” or “Project“), located in the province of Antsiranana in north eastern Madagascar.
Harena has engaged leading global engineering group SGS to support technical inputs to the PFS and also to conduct an update of the 2023 Mineral Resource Estimate to JORC 2012 standard.
The compilation of the PFS has been internally managed by Harena. The initial study was conducted in order to meet regulatory requirements for the conversion of the Permit Research licence to a Permit Exploitation licence.
Several programs of metallurgical testwork were conducted by SGS and results emanating from several bulk sample leaching programs have been employed into the PFS design.
In line with international standards for feasibility studies, the PFS is generally in line with AACE Class 4 estimates and accuracy is in range of -30/+40. The planned on-site Proof of Concept demonstration plant will allow these estimates to be greatly enhanced and derisked.
Key PFS Outcomes and Assumptions
The PFS confirms the robust technical and economic viability for development of a mining and processing operation to produce a MREC product at the Ampasindava Project.
This has included:
|
• |
An updated global Mineral Resource Estimate of 606,000 tonnes of TREO with: |
|
|
|
° |
41kt of TREO in Measured Resources, |
|
|
° |
Indicated Resources of 156kt of TREO, and |
|
|
° |
Inferred Resources totalling 410kt of TREO. |
|
• |
The hand-sinking of 4,474 vertical test pits up to 10m deep, |
|
|
• |
Some 31,000 pit samples across the pedolith and saprolite areas of the pits, |
|
|
• |
A total of 277 vertical diamond drill holes, |
|
|
• |
Maximum head grades of 2.24% TREO and a global average of 868 ppm TREO, |
|
|
• |
Substantial metallurgical testwork with SGS and other consultants over several years of testing, including at least two bulk sample programs, |
|
|
• |
A range of yield payability favouring higher demand TREOs and resulting in a nett of 75%, and |
|
|
• |
The use of 3 to 4 concurrent satellite mining pits to ameliorate risk and optimise grade recovery. |
|
A summary of the physical and financial evaluation of the Project utilising a heap leach farm with a 5.0 Mtpa throughput rate is shown in Table 1 below. Additional details are set out below in the descriptive summary.
Table 1: Production Outcomes and Assumptions – Base Case
|
|
Parameter |
Unit |
Amount |
|
LOM |
Years |
20 |
|
|
LOM Feed |
M tonnes |
88 |
|
|
LOM Waste |
M tonnes |
13 |
|
|
LOM Strip Ratio |
Avg |
1:6 |
|
|
LOM TREO Head Grade (static model) |
ppm |
1,525 |
|
|
Total REO Feed |
k tonnes |
134.6 |
|
|
Total REO Production |
k tonnes |
71.1 |
|
|
Average REO Production |
k tonnes / annum |
3.5 |
|
|
Average TREO Payability |
% |
75 |
|
|
Total LOM Revenue |
US$M |
4,481.7 |
|
|
REO Revenue |
US$ / kg REO |
63 |
|
|
Magnet REO (NdPr + DyTb) Ratio in Conc. |
% |
42% |
|
|
Magnet REO Value in Conc. |
% |
93% |
|
|
Total LOM OPEX |
US$M |
2,743 |
|
|
OPEX, average |
US$M / annum |
137.1 |
|
|
OPEX, average |
US$ / tonne Ore |
31.3 |
|
|
OPEX, average |
US$ / kg REO |
38.5 |
|
|
CAPEX, upfront |
US$M |
142 |
|
|
CAPEX, ongoing |
US$M |
19 |
|
|
EBITDA |
US$M |
1,502 |
|
|
Free Cash Flow (Post Tax) |
US$M |
1,015 |
|
|
Net Present Value (Post Tax) (Real) 10% |
US$M |
249.6 |
|
|
Internal Rate of Return (Real, Unlevered) IRR |
% |
30 |
|
|
Payback |
Years |
4 |
Mineral Resource Estimate Detail
SGS was commissioned by Harena to review and restate the 2023 MRE in accordance with the guidelines of the JORC 2012 Code. The restated MRE issued by SGS (Camus, 2023) summarised below has an Effective Date of 1 November 2023:
The relevance of this resource supports many important project enablers. The fact it is an ionic clay resource leads to low capital and low operating cost metrics. Simple, cheap salt washing is all that is required to liberate the ionised adsorption bond of rare earth minerals from the gangue material they are held with.
Well-structured ionic clay deposits are rare and the deposit at the Ampasindava Project is as good as any from a global perspective.
Table 2. Mineral Resource Estimate for Ampasindava Project Deposit at Cut-Off of 500 ppm TREO
|
Classification |
Tonnage |
Volume |
Area |
Density |
Thickness (m) |
TREO |
MREO |
MREO / |
Contained |
Contained |
||
|
Total |
PED |
SAP |
||||||||||
|
Measured |
42.5 |
38.1 |
7.0 |
1.11 |
5.46 |
2.85 |
2.60 |
958 |
221 |
23% |
40,700 |
9,400 |
|
Indicated |
184.0 |
167.1 |
25.0 |
1.10 |
6.70 |
2.65 |
4.04 |
842 |
178 |
21% |
154,800 |
32,700 |
|
Measured |
226.5 |
205.3 |
31.9 |
1.10 |
6.43 |
2.70 |
3.73 |
863 |
186 |
22% |
195,500 |
42,100 |
|
Inferred |
472.0 |
429.1 |
78.9 |
1.10 |
5.44 |
2.71 |
2.73 |
870 |
189 |
22% |
410,500 |
89,000 |
|
Total |
698.5 |
634.3 |
110.8 |
1.10 |
5.72 |
2.71 |
3.02 |
868 |
188 |
22% |
606,000 |
131,100 |
|
1. |
The Mineral Resource Estimate (MRE) has an effective date of the 1st of November 2023. The Competent Person for the MRE is Mr. Yann Camus, P.Eng., an employee of SGS. |
|
2. |
The classification of the current Mineral Resource Estimate is consistent with the 2012 Australasian Code for Reporting of Exploration Results, Mineral Resources and Ore Reserves (the JORC Code). |
|
3. |
All figures are rounded to reflect the relative accuracy of the estimate and numbers may not add due to rounding. |
|
4. |
All Resources are presented undiluted and in situ, constrained within a 3D model, and are considered to have reasonable prospects for eventual economic extraction. |
|
5. |
Mineral resources which are not mineral reserves do not have demonstrated economic viability. An Inferred Mineral Resource has a lower level of confidence than that applying to an Indicated Mineral Resource and must not be converted to a Mineral Reserve. It is reasonably expected that the majority of Inferred Mineral Resources could be upgraded to Indicated Mineral Resources with continued exploration. |
|
6. |
Bulk density values were determined based on physical test work from each part of the deposit. |
|
7. |
The base cut-off grade (500ppm) TREO considers a mining cost of US$1.40/t mined, processing cost of US$8.00/t mined, and G&A cost of US$0.75/t mined. |
|
8. |
TREO = Y2O3+Eu2O3+Gd2O3+Tb2O3+Dy2O3+Ho2O3+Er2O3+Tm2O3+Yb2O3+Lu2O3+La2O3+Ce2O3+Pr2O3+Nd2O3+Sm2O3 |
|
9. |
MREO = Pr2O3+Nd2O3+Tb2O3+Dy2O3 |
|
10. |
The estimate of Mineral Resources may be materially affected by environmental, permitting, legal, title, taxation, socio-political, marketing, or other relevant issues. |
Important note:
The Company advises that the PFS is based on the JORC 2012 Mineral Resource Estimate, however, a Mineral Reserve has not yet been estimated. There is no certainty that further economic assessment will result in the eventual conversion of Mineral Resources to Ore Reserves or that the production target itself, assumptions used in the Study and resulting economic outcomes will be realised. The stated production target is based on the Company’s current expectations of future results or events and should not be solely relied upon by investors when making investment decisions. Further evaluation work and appropriate studies are required to establish sufficient confidence that this target will be met. Engineering studies and estimates including peer works support capital and operating cost estimates and are based on standard extraction and processing techniques. Non‐binding discussions are underway with interested parties for offtake of planned production. Discussions with third party infrastructure providers are underway. Extensive environmental baseline studies have been completed and no social, environmental, legal or regulatory impediments to development have been identified. The Pre-Feasibility Study is based on 100% of Measured and Indicated Resource. A Mineral Reserve has not been estimated at this time.
Project Design and Philosophy
The Ampasindava Project is a large-scale, long-life, REE Project in north eastern Madagascar. REE will be extracted from a 20 km long near surface ionic adsorption clay ore-body spanning the peninsular of Ampasindava in the province of Antsiranana in northern Madagascar. According to the PFS, commencing at 2.5 million tonnes treated per annum, by year 5, the Project will be processing 5 million tonnes of ionic adsorption clay ore through two process plant modules producing an estimated 4,000 tonnes of TREO despatched as 6,700 tonnes of mixed rare earth carbonate concentrate (MREC) at 60% per annum with an annual value of approximately US$250 million.
Some 88 million dry tonnes of ionic clay ore are expected to be processed, extracted and returned to the mine cavities over the 20+ year Project life. The Project is expected to deliver estimated gross royalty payments to Madagascar of US$220 million plus corporate tax contributions of US$320 million over its life based upon the existing JORC Mineral Resource Estimate (MRE) as of November 2023.
The proposed mining and processing sequence which is labelled “A rapid remediation, zero harm mining system”, returns neutral and non-toxic clays back to the mining cavity within a very short timeframe, allowing for land re-use or natural rehabilitation to occur. The system involves:
|
• |
Operating from 3 or 4 concurrent satellite mining pits within the mining zone |
|
• |
Removal and temporary storage of a 0.6m thick surface layer of topsoil that will be replaced following complete backfill of the mining pit |
|
• |
Removal of an average 5-6 metre layer of ionic-adsorption REE clay ore using truck and shovel and hauling this material to the process plant |
|
• |
Transport of the material to a ring-fenced leaching farm which is environmentally isolated from natural water courses and the effects of excessive rainfall |
|
• |
Agglomerating the ionic-adsorption REE clay to increase its permeability before placing it in 3m high stacks on top of an impermeable lining |
|
• |
Placing mobile irrigating pipe systems on the heaps |
|
• |
Desorbing the ionically adsorbed REE first into natural sea water and then into an ammonium sulphate lixiviant at pH 4 that is percolated through the clay-ore heap onto the HDPE liner which directs it to a process liquor pond |
|
• |
Concentrating the REE within the ammonium sulphate lixiviant via an ion exchange process in a nano filtration membrane circuit. This step will consequently produce large volumes of clean and neutral water that will be available for use as process water, dust control and irrigation of crops |
|
• |
Returning the “spent-ore” to the mining pit once the REE has been desorbed from the clay and residual ammonium sulphate has been washed out |
|
• |
Returning the overburden to the mining pit which in combination with the returned “spent-ore” will completely fill the mining void. |
The full mining, processing and rehabilitation cycle is expected to be about 3 months and the moving mining footprint will be similar to the area disturbed by 3 months of mining which will be between 10 and 15 hectares.
The Project will preferentially employ local people with the appropriate skills and qualifications over the life of the Project and expects that almost all the 400-person workforce will be Malagasy by Year 5. Adult skills training and a focus on education support will develop local capacity and facilitate employment of local people including women into technical and managerial roles with the Project.
A comprehensive Environmental and Social Impact Assessment (ESIA) of the Project is being undertaken in accordance with Office of Natural Environment (ONE) requirements and following IFC standard best practices. The social program and procurement strategy is based on the mantra – Local First, Regional Second and National and International Third. The intention is to create sources of income and wealth centres for local, impoverished Malagasy and secure a sense of local ownership of the Project. This inspires commitment, protection and self-interest to protect and uplift the project.
Process Recovery Methods
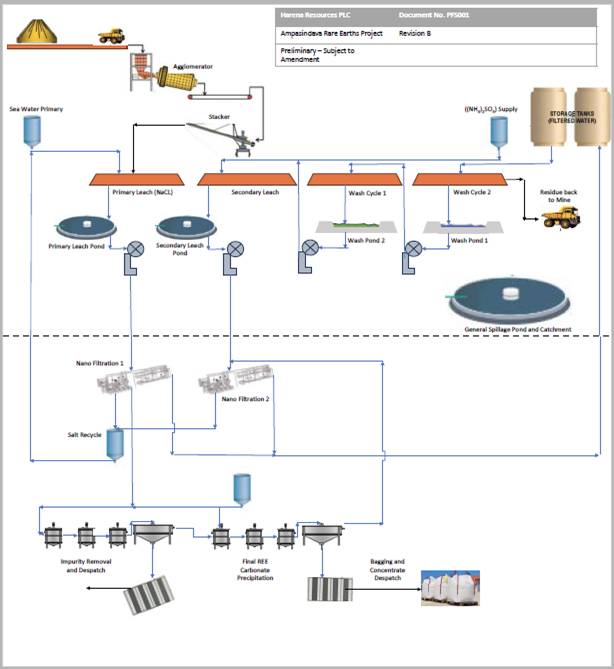
Ionic adsorption clay deposits are known for their relatively simple low capital processing arrangements. REE adsorbed onto clays are simply desorbed using an ion-exchange-based elution process with eluants such as sodium chloride or ammonium sulphate.
Ore is agglomerated at the ROM pad before being stacked in heaps of 80m width and 240m length on a sealed impervious layered heap foundation. There will be 26 of these heaps for a 5 Mtpa production cycle.
Heaps are 3m high but can sometimes be built higher to increase production. Drip irrigation is used to minimize evaporation, provide more uniform distribution of the leach solution, and avoid damaging the exposed mineral.
The solution then percolates through the heap and desorbs both the target and other minerals. This process, called the “leach cycle,” generally takes from less than one month for simple oxide ores. The leach solution containing the dissolved rare earths is then collected, treated in a simple process plant to recover the mixed rare earth as a carbonate product. The mother liquor, now rich in ammonium sulfate is recycled to the heap after reagent levels are adjusted. Ultimate recovery of the target mineral can range up to 80%
Heap leaching does not produce large tailings dams and the amount of overall environmental impact caused by heap leaching is often lower than more traditional techniques and is therefore more environmentally friendly. It also requires less energy consumption to use this method, which many consider to be an environmental alternative.
The indicative and conceptual process flow sheet is indicated below in Figure 1.
|
|
|
Figure 1. Conceptual Flow Sheet for the Ampasindava Project Heap Leach Ores |
Organisational Planning
The Ampasindava Project organisational chart is listed below in Figure 2. The organisational chart allocates operational responsibility amongst the functional contractors and service providers.
Each functional contractor and service provider will include their required personnel structures and staff numbers in the tender procurement process. This will allow the Company to scale the camp and personnel transport facilities accordingly.
|
|
|
Figure 2. Organisational Structure of Mine Operations |
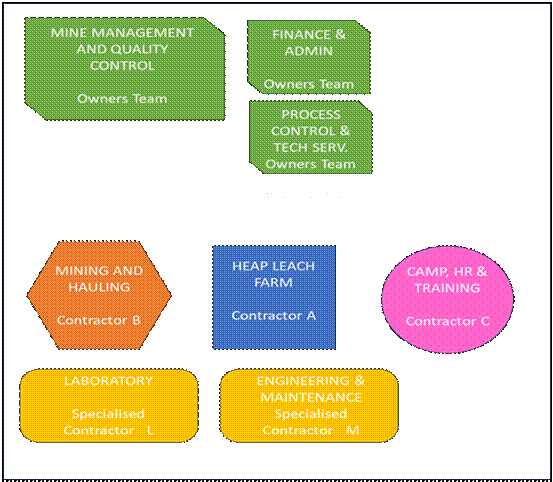
The fully-outsourced procurement model is functionally attractive for the construction and operation of remote mining operations. The specialist engineering and operations are left to functional experts and owner’s mine management can oversee and focus on the core mineral beneficiation function.
It is expected that at least 50% of the mine personnel will live in private accommodation in villages nearby.
Capital and Operating Costs
The capital cost estimate is broken down into the main areas of infrastructure, camp and offices, mining and processing plant and associated project costs, as shown in Table 3. The mining capital cost estimate was developed by Harena with input from contract mining service providers elsewhere in Africa and the general and plant capital cost estimate was developed by first order assessments from other projects located globally.
The capital estimate is subject to a study upgrade where the PFS will be enhanced to definitive level and the capital estimates will be supported by design criteria and a higher level of supplier enquiries and quotes.
Table 3. Ampasindava Project summary of CAPEX breakdown (in US$M).
|
Breakdown |
Area |
Est |
USDm |
|
|
Management |
Owners Cost |
Budget |
3.0 |
|
|
Design and Build |
Est % |
18.0 |
||
|
Funding Cost and Fees |
Est |
9.0 |
||
|
Contingency |
Total % |
4.0 |
||
|
Mining Fleet |
Mixed Plant |
Est |
8.5 |
|
|
Heap Farm & Process |
Earthworks and Engineering |
Est |
7.0 |
|
|
Leaching Infrastructure |
Eng |
10.1 |
||
|
Power and Water |
Est |
14.0 |
||
|
RO and Nano Filtration |
Est & Quote |
60.0 |
||
|
Other Infrastructure |
Roads and Camp |
Est |
5.2 |
|
|
Water Borne and Other |
Est |
0.8 |
||
|
Communication and FIFO |
Est |
2.7 |
||
|
Total |
|
|
142.34 |
|
|
Ongoing |
|
|
19.00 |
|
|
Total LOM
Closure Costs |
|
Est |
161.39
14.5 |
|
The operating cost estimates were developed in loose collaboration with mining contractors from other African projects, engineering consultants in Australia and other local cost indexes.
The operating costs were prepared using the WBS and some equipment lists generated for the project. These estimates were prepared in US$.
Table 4. A summary of the operating costs estimate broken down into respective components.
|
OPEX Breakdown |
LOM OPEX US$m |
Average Annual OPEX, US$m |
Average OPEX, US$/kg REO |
Average OPEX, US$/tonne ROM |
% of Total |
|
Mining |
844.8 |
42.2 |
11.5 |
9.6 |
30.8 |
|
Processing |
1,050.6 |
52.5 |
14.7 |
11.9 |
38.3 |
|
Other Direct Costs |
499.5 |
25.1 |
7.0 |
5.7 |
18.3 |
|
Overhead |
343.9 |
19.2 |
4.8 |
3.9 |
12.6 |
|
TOTAL |
2,743 |
136.9 |
38.5 |
31.1 |
100 |
1.14 Manning and Personnel
It is intended to source skilled and semi-skilled staff under the following guiding principles:
|
• |
Local First, |
|
• |
Regional Second, |
|
• |
National Third, and |
|
• |
International only for highly specialised and temporary assignments. |
The Paterson system of job ranking will be used and there will be no discrimination on the basis of gender, age, race or disability. Thus, all appointments will be merit based.
Approximately only 8 Expatriate Staff will be forecast to work at the operation during the initial years. These will be specialist Process and Engineering skills that will assist in reaching the demanding production rate of 5 million tonnes processed per annum.
On the job training and skills development of Malagasy professionals will allow these expatriate employees to retreat. Most staff will be encouraged to live in nearby towns and establish localised homes and encourage a family working environment.
Table 5. Operational Manning Estimate
|
Functional Element |
Number |
Owner |
|
Owners Management |
10 |
Owner |
|
Mining |
169 |
Contractors plus |
|
Processing |
62 |
Owner/Contractor |
|
Engineering |
66 |
Contractor |
|
SHEC |
42 |
Contractor |
|
Admin |
29 |
Contractors |
|
Total |
378 |
Please refer to the PFS announcement available on Harena’s website for an Employment Organigram for the Ampasindava Project Rare Earth Mine.
Next Steps – Proof of Concept Plant
The critical next step for all leach operations is the test and proof that the design process operates under ambient conditions in the field adjacent to the mineral source. Harena plans to permit and construct a Proof of Concept (PoC) plant at the mine processing site. This exercise will take approximately 9 months and will operate for as long is necessary to provide de-risked operating confirmation of the process and leach lixiviant requirements, the environmental outcomes and the economic and technical viability of the planned operation.
Following successful deployment of the PoC, the Company will move to further design and a Decision to Mine which would launch construction and project activities proper.
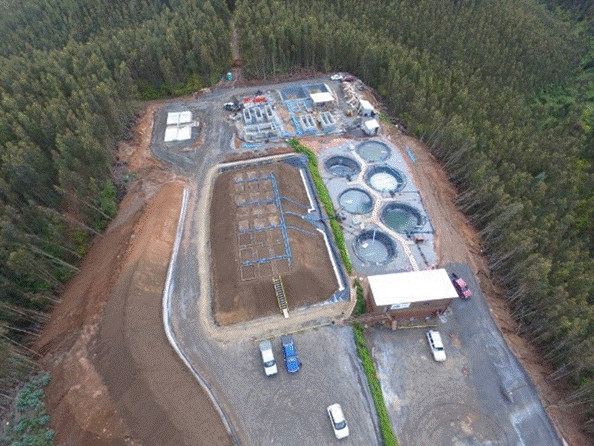
The image below in Figure 3 is a representative Project in Chile but is a good representation of a Proof of Concept heap leach and recovery mine plant. It appears that about 5,000 to 6,000 tonnes was heap leached here.
|
|
|
Figure 3. Representative image of a PoC plant operating in Chile |
Project planning for the PoC project includes the following steps:
The Company wishes to fast-track progress on the Proof of Concept Plant. Validation of an in-house metallurgical design flowsheet is essential for funding and market confidence. This process can take up to 12 months or more depending on results achieved.
The PoC plant development process will be staged. The first stage will be as follows:
|
1. |
Mining Permit for Extraction; |
|
2. |
Interim environmental approval from ONE; |
|
3. |
Social and regional approvals and acknowledgement from local stakeholders; and |
|
4. |
Construction commences to facilitate permanent laboratory. |
The process to be followed will be:
|
• |
Building of a life of mine shed at site which will accommodate suitable numbers of columns, small cribs and then larger cribs to be acquired in country; |
|
• |
Diesel power supply for lighting, pumps and fans; |
|
• |
Cement mixer type agglomerator and hand held material handling; |
|
• |
Suitable starter laboratory such that the works can be measured and assessed; |
|
• |
Small salts storage and mixing area with appropriate ventilation and handling facilities; |
|
• |
Small office and ablutions to provide support; and |
|
• |
Fit for purpose communications infrastructure. |
Based on success achieved operating the on-site facility, the PoC will be expanded into the main facility immediately upon activation thereof. This will be termed stage 2. The process to be followed will be:
|
a. |
Appointment of the technical team to lead mining, leaching and recovery. |
|
b. |
Brief level 1 design of the PoC mine and limited infrastructure – much can be disposable. |
|
c. |
Individual scopes of work for 4 packages representing the four areas of operation. These should reflect a minimalistic approach for limited services. |
|
d. |
Approval of program and budget from Ionic RE Executive. |
|
e. |
Submission of Environmental Amendment to ESIA. |
|
f. |
Follow on application to Mines Department for exemption to commence on small scale. |
|
g. |
Regulatory approval/exemption from Ministry. |
|
h. |
Procurement Inquiries to approved vendors for equipment and services as required. |
|
i. |
Procurement request for Interest on various contract works with local approved construction and engineering and earthworks companies. |
|
j. |
Communication and relocation of limited affected persons. |
|
k. |
Contractor approval and execution of main two contractors for primary construction, power supply, water and other services including base temporary roads. |
|
l. |
Operational plan from same two contractors, if possible. |
|
m. |
Development of technical and management control systems for Rwenzori RM and Ionic RE. |
|
n. |
Mobilisation to site and commencement of 1st pad and temporary infrastructure. |
Schedule
Initial planning for the demo plant to have completed its purpose was set at a time period of 240 days. Contingent issues affecting the schedule are:
|
• |
Effective planning and adequate scope inclusions; |
|
• |
Permissions from the Ministries and the possible need for exemptions/deferrals; |
|
• |
Logistic solutions and regulatory impacts; |
|
• |
Long Lead Time items, such as the RO plants and other, and |
|
• |
Re-iterations and the ease with which these can be commenced.
|
Budget for PoC
The budget for the demo plant currently stands at US$11.5m to be spent after award of the Mining Permit Exploitation and the rising of capital to construct.
The major cost unknown is not the construction cost and this amount may be adequate. However, the duration of operation of the PoC mine could require significant contingent provisions.
The approach would be that if an early enough confidence can be achieved with the initial 90 days plus 30 days operation of the leach pad and assuming that regulatory licences have been issued, an opportunity is created for an accelerated build of the mine can be commenced, making the extended operation of the PoC mine much more acceptable and somewhat more cost effective.
Please refer to the PFS announcement available on Harena’s website for a summary of the budget for Proof of Concept Construction Capital.
Permitting
The conversion of a mining exploration licence (PR) to a mining exploitation licence (PE) in Madagascar is primarily governed by Law No. 2023-007 (New Mining Code). This process is managed by the Bureau du Cadastre Minier de Madagascar (BCMM) under the authority of the Ministry of Mines.
Current requirements for conversion (transformation) include:
Environmental and Social Compliance
|
• |
Environmental Impact Study (EIE); |
|
• |
Social Responsibility Plan (PRSE): Applicants must submit a plan for social responsibility and contribute to the Mining Fund for Social and Community Investment (FMISC); and |
|
• |
Environmental Rehabilitation Plan. |
Technical and Financial Requirements
|
• |
Pre-Feasibility Study; |
|
• |
Cahier des Charges Minières (CCM): Every permit must include a specifications book detailing specific technical and financial obligations; and |
|
• |
Workforce Requirements |
Legal Status and Tenure
Eligibility where the applicant must be a legal entity registered under Malagasy law. Under the new code, a PE is valid for 25 years, renewable once for 15 years (reduced from the previous 40-year term). The permit holder must secure a lease agreement or prior agreement from the landowner for surface rights.
Applications for transformation are currently being processed by the BCMM following the lift of a previous moratorium, though a ministerial order from the Minister in charge of Mines is still required for each final approval.
Pricing Assumptions and Forecast Methodology
The economic model has been developed using long term pricing from a recognised market analyst and Artificial Intelligence forecast consensus pricing.
The base case economic indicators have been derived using the market analyst pricing which has been developed prior to the recently highly publicised interventions into the Rare Earths market by an alliance of Western Nations concerned by the dominant position of China in the processing and refining of these products.
In regard to the different forecasts for the magnet metals, prices forecast by AI are Nd (1/3rd), Pr (1/3rd), Dy (2/3rds) and Tb (1/3rd) higher than the more conservative and earlier forecast by the market analyst.
These forecasts are underpinned by open-sourced comprehensive analysis of global supply and demand trends. On the demand side, projections reflect anticipated growth in key sectors such as electric vehicle drive-trains, wind turbines, energy transition technologies, robotics, and particular military defence applications. Supply assumptions incorporate current global production levels and publicly announced future projects, offering a well-rounded view of the evolving market.
Sensitivity Analysis
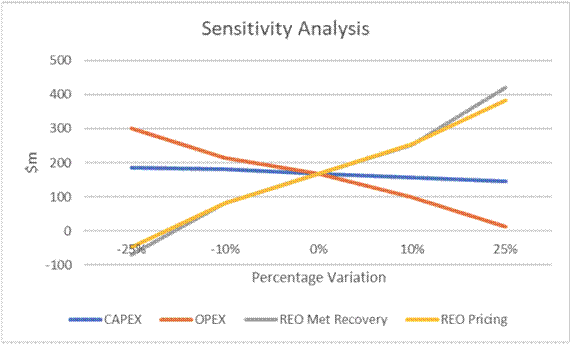
A sensitivity analysis was performed for the Project, highlighting its resilience to variations in capital costs, operating costs, REO recoveries and Prices.
The results of the sensitivity analysis variable intervals of +10%/-10% is indicated in the graph below, highlighting that the Project is particularly sensitive to REO prices received and metallurgical recoveries. This would imply that particular care will be taken during the operations of the afore-mentioned Proof of Concept plant to optimise these recoveries, even at the expense of some extra cost inputs.
|
|
|
Figure 4. Ampasindava Project Sensitivity Analysis for base case conditions. |
Forward Work Program
The forward work program has been allocated to three distinct estimated time related milestones.
|
Award of Mining Licence and further permitting requirements |
Q1 2026 |
|
Operations of Proof of Concept Plant and feed results into final design parameters |
Q2 2027 |
|
Detailed design and Financial Investment Decision (FID) |
Q4 2027 |
The Company has developed a Joint Roadmap to production as a communication and planning tool for the Project and financial stakeholders. The stakeholders of the Project have been identified as:
|
• |
Members of Harena Rare Earths PLC and investors; |
|
• |
Government of Madagascar in many regulatory and fiscal forms; |
|
• |
Local residents and stakeholders at the mine site and regionally; |
|
• |
Employees of various group companies; |
|
• |
Contractors and service providers; |
|
• |
Customers, other clients and buyers; and |
|
• |
Other interested Governments and product beneficiaries. |
Please refer to the PFS announcement available on Harena’s website for the Ampasindava project process flow mapping.
Material Assumptions and Outcomes
The PFS was completed with the following material assumptions:
|
• |
Clay winning will be via several (up to 5) satellite pits operating simultaneously and sharing the mining and trucking fleet. |
|
• |
Ore to be excavated through conventional mobile machine operations and trucked to the heap leach farm. No requirement for blasting. |
|
• |
Topsoil will be stockpiled in accessible piles near the mining area so it can be used for rehabilitation once a section of the pit has been backfilled and contoured to final landform. |
|
• |
The processing heap leach farm will be 5.2 Mtpa and the monthly requirement for material movement will on average be 280,000 cubic metres (bcm) of mineralised clay per month. An additional 35,000 bcm of topsoil and waste is to be moved and stored near the pits each month. |
|
• |
The mine grade has been assumed to be 75% of the average of two bulk samples excavated from the orebody. This aligns with a concerted effort to selectively mine high-grade areas of the orebody. |
|
• |
Overall metallurgical yield has been calculated at 53% TREO. Individual oxide elemental recoveries have been applied as per the test work results. |
|
• |
Revenue is based on individual REO prices as supplied by the market analyst multiplied by individual oxide recoveries. These values reflect gross forward looking revenue streams. An individual payability factor per metal is assumed where higher value/demand products can negotiate better differential payabilities. The highest payability assumed is 80% for Gd2O3 and the lowest is 40% for CeO2. The average basket payability achieved is 75%. |
|
• |
The economic model is denominated in US dollars (USD). |
|
• |
Transportation charges for MREC is estimated at $200/tonne concentrate shipped. Transport charges ex-Madagascar to the separation plant customer have been reflected within the estimated payability factor. |
|
• |
A mine life of 20 years has been assessed for practicality. The African, remote location has meant a discount factor 0f 10% has been used. The tax rate is 20% and the royalty rate is 5% of gross value. |
|
• |
Generally, sea-borne logistics will be used for off-mine transport and supplies/delivery of equipment. Air-borne logistics will be used for personnel travel outside the mine region. |
|
• |
Power consumption is moderate, at about 4MW and will be provided by hybrid solar supported by diesel generation. |
|
• |
Mine plant will initially be contractor owned with a support facility for local truck driver economic aide to purchase mine spec trucks and provide contract deliveries to the heap leach farm. |
|
• |
Camp operations will be outsourced, including the capital and construction. |
Material Modifying Factors
The following modifying factors were considered in relation to the assessment of this PFS:
Location
The Ampasindava Project is located in the eastern part of the Ampasindava Peninsula, Antsiranana Province on the northwest coast of Madagascar, approximately 500 km north of Madagascar’s capital city Antananarivo. The nearest major town and administrative centre of the region is called Ambanja and is located some 40 km to the northeast of the project area.
The PFS area has ample land for mine development, processing infrastructure, and future expansions.
The proposed pits and processing facility will be well-connected via a network of paved roads and private gravel roads, facilitating efficient ore transport. The entire mine zone and proposed heap leach farm will be within 10kms of each other.
Power Supply
Power is not readily available in the project area from the national grid. Power at the mine site, expected to require some 6MW, will be supplied by diesel generator units and supplemented by solar installation and battery storage for low critical applications.
The Company will supply the electrical generator equipment for the heap leach processing plant and a 11kV main substation including 2 incomer circuit breakers. In addition, diesel tanks, pump and piping from the tank to the gensets as well as the paralleling and synchronisation control system.
Generator specifications KH-1000GF set 6 Including diesel boxes, generator control units and 400V switchgear. Also installed will be a DMC 1500 power command paralleling system to balance loads from the power plant.
Water Supply and Management
The Project will incorporate advanced water recycling technologies, including ultrafiltration and reverse osmosis (RO) systems, to minimise freshwater consumption and ensure minimal industrial effluent discharge. Freshwater is available through on-site bores. Sea water is abundant and nearby as the project is within 3km of the coast. The ore beneficiation process is designed for high water efficiency, with >75% of process water recirculated within the plant.
Water consumption for the Ampasindava Project is expected to be low. This basis is derived from:
|
• |
Net positive water balance of the process; |
|
• |
The project areas high annual rainfall; |
|
• |
The process arrangement using heap leaching and maximised water recycling using membrane technology for reagent recovery, resulting in fresh water recovery; and |
|
• |
Given the low forecast water consumption, it is proposed that water for both processing operations and dust management is to be sourced by water harvesting ponds on site and from the mining pit. |
During periods of extended dry weather, it is proposed that water could be sourced from boreholes up to 10km from the project area, although local groundwater resources potentially also a source, however, limitation on drawing from local groundwater could limit this option.
Labour and Accommodation
The operation is to be staffed by a residential workforce. No fly in – fly out other than specialised technical and management skills is envisaged and the number of expatriates staff is intended to be low, and to be being phased out over the first 7 years of operations.
The region is poverty stricken and there is no shortage of unskilled and semi-skilled labour. A workforce of semi-skilled and artisanal workers is available in nearby townships and population centres. The closest major population centre is Ambanja, which has a population of 50,000.
The township of Anjiabory is approximately 10km from the project site and the intent is to source local operations staff from the immediate districts and train staff accordingly.
Environmental
The Company has submitted seven environmental monitoring reports. These reports were completed in order to be compliant to the regulation of the Office National de l’Environnement (ONE) and the Ministry of Mines of Madagascar.
From the point of view of environmental considerations, no sensitive area has yet been established within the exploration license for the period. However, the northeastern part of that exploration license, and an area of approximately 100 km2, is located in a priority area for the establishment of protected areas.
The environmental and social programs will strive to meet international IFC standards.
For further information please contact:
|
Harena Rare Earths Plc Ivan Murphy, Executive Chairman Allan Mulligan, Executive Technical Director
|
+44 (0)20 7770 6424
|
|
SP Angel – Joint Broker Ewan Leggat / Josh Ray (Corporate Finance)
|
+44 (0)20 3470 0470 |
|
Marex Financial – Corporate Advisor Angelo Sofocleous / Keith Swann / Matt Bailey (Broking) |
+44 (0)20 7655 6000 corporate@marex.com |
|
Allenby Capital – Financial Adviser & Joint Broker Jeremy Porter / Vivek Bhardwaj (Corporate Finance) Amrit Nahal / Kelly Gardiner (Sales & Corporate Broking) |
+44 (0)20 3328 5656 info@allenbycapital.com |
|
Muriel Siebert & Co. – US Financial Adviser & Broker Ajay Asija, Co-Head of Investment Banking |
+1 (917) 902 7823 aasija@siebert.com |
|
Celicourt Communications – Public Relations Mark Antelme / Charles Denley-Myerson |
+44 (0)20 7770 6424 harena@celicourt.uk |
Ian Pollard – Bonmarche #BON Rejects Takeover Bid – But Only Asks For Talks
 Bonmarche Holdings BON which had seen trading become significantly weaker than expected sine the beginning of March, has rejected a takeover bid from Phillip Day’s Spectre Holdings, on the basis that it undervalues the business and its future prospects. These included a rise in the underlying loss for the year from a possible £4.0m. to between £5.0m. and £6.0m. 2 April, Mr Day, who owns Edinburgh Woollen Mill Group, acquired 26 million Bonmarché shares at 11.445p a share, which brought his stake up to 52.4% and a warning that he expected a “material reduction” in staff. The Bonmarche Board was left with nothing but the expression of a wish to hold discussions, which would be for the benefit of all shareholders, including no doubt, themselves. So far they appear to be unable to find a reason why shareholders would benefit from their continued presence in the governance of the company, especially having regard to its recent continued decline under their stewardship.
 Games Workshop Group GAW has today declared a dividend of 35 pence per share, in line with the Company’s policy of distributing truly surplus cash and to be paid on 31 May.This takes the total dividend declared and paid during the year ending 2 June 2019 to £1.55 per share. Trading has continued well since the half year report in January with sales and profits ahead of last year. The Board’s current expectations are that profit before tax for the year to June 2019 will be c. £80 million.
/plus500_source-5c5b58f746e0fb0001ca8550.png) Plus 500 Ltd PLUS updates that financial markets in the three months to the end of March were extremely subdued and revenue.fell by 65%. New customers were down by 10%. The company that It is impossible to predict market conditions for the rest of the year and conclusions can not be drawn about the full year outcome based on the Group’s first quarter performance.
Plus 500 Ltd PLUS updates that financial markets in the three months to the end of March were extremely subdued and revenue.fell by 65%. New customers were down by 10%. The company that It is impossible to predict market conditions for the rest of the year and conclusions can not be drawn about the full year outcome based on the Group’s first quarter performance.
 Mobile Streams plc MOS has had to undergo a comprehensive cost-cutting exercise, in fact so comprehensive that both Non-Executive Directors have had to volunteer a deferral of 50% of their respective remuneration. Sizable one-off redundancy and severance payments have had to be made, to employees, many of whom were of long service. With falling revenue, decisive steps became necessary to allow the company to preserve and protect its remaining cash balances.
 National Express NEX has acquired a 60% stake in WeDriveU an employee shuttle company serving many of the world’s largest and fastest growing companies in Silicon Valley and other fast growing US cities.. The deal also includes an Option to acquire the remaining shares in tranches over the next three years.
Beachfront villas & houses for sale in Greece; http://www.hiddengreece.net
Ian Pollard: TUI Impacted By Heatwave And Headwinds
 TUI AG TUI has seen its first quarter performance so impacted by accountancy adjustments that the figures have become virtually meaningless due to the first-time application of IFRS 15 and of IFRS 9 in the previous year. The best that that can be said is that performance has been in line save for markets and airlines which were weak and faced signs of headwinds.The summer heatwave was partly responsible for that together with overcapacity in Spain due to the shift in demand to the Eastern Mediterranean. The growth strategy however is said to be intact. Markets & Airlines must be something of a problem because the headwinds which are buffeting it get repeated mentions, one after another in the story of what appears to have been a not very satisfactory first quarter.
 Plus 500 Ltd PLUS produced a record financial performance in the year to the 31st December, after an exceptional first quarter benefitting in particular from Crypto currency trading. It is expected that 2019 profit will be materially lower than current market expectations. The company describes 2018 as a momentous year, well ahead of original expectations with revenue up by 65%, EBITDA by 95%, earnings per share by 90% and dividends by 18%.

 Loop Up Group plc LOOP has traded strongly in 2018, with revenue in line with consensus expectations and profitability comfortably ahead. It was a year of transformational growth with new offices seen in Chicago, Dallas, LA, Atlanta and Madrid. Continuing strong demand is seen for the LoopUp product in 2019
Beachfront villas & houses for sale in Greece; http://www.hiddengreece.net
Ian Pollard – Whitbread #WTB, a solidly good year!
 Whitbread plc WTB can not quite make its mind up as to whether its full year results are good or solid, so to be on the safe side, it claims they are both.On an underlying basis revenue rose by 2.6% and profit before tax by 2.5% which is hardly impressive. On a statutory basis, operating profit and profit before tax rose by 0.1% and 0.2% respectively, which appears to be neither good nor solid. Even solidly good seems to be a bit of an exaggeration.
The man event of the year was was the sale of Costs to Coca Cola for £3.9bn. A significant majority of the net cash proceeds will be returned to shareholders but not just yet because regulatory approval is still required from the EU and perhaps more importantly China. Trump had perhaps best tread carefully on the sanctions front if he wants Coca Cola to get its approval. The one figure which does stand out among these somewhat mundane results is that the shareholders are to be well looked after with a dividend rise of 4%.
 Bunzl plc BNZL Third quarter Group revenue rose by 7% at constant exchange rates due to a mixture of organic growth of approximately 4% and an impact from net acquisitions, of approximately 3%. This is as expected at the time of the half year results.Since then Bunzl recently has entered into an agreement to acquire Volk do Brasil which .will expand its already well established safety business in Brazil
 Plus500 Ltd PLUS expects trading for 2018 will now be ahead of expectations. Despite a third quarter drop in revenue of 14%, the nine month figures show a healthy rise in revenue of 86% whilst the number of new customers has risen by 19% and the number of active customers by 74%.
 Intu Properties plc INTU has continued to deliver a strong and resilient operational performance from 1st July to the 23rd October but it has not been able to ignore the fact this has been a particularly challenging period for UK retailers. Rent reviews settled in the period have on average been 5 per cent above previous reviews but significantly anticipated growth for 2018 is expected to be no more than 0 to 1% as tenant failures impacted the figures by some 1.5 %.and footfall for the year fell by 1.3%. The occupancy rate however rose to 97%
Forget Brexit; Get A Greek Residence Permit Valid For The EU http://www.hiddengreece.net
Ian Pollard – Plus 500 #PLUS Benefits From Trump Tariffs
 Plus 500 Ltd PLUS has again, after a strong second quarter, performed strongly in the first half and materially increased its expectations for the Group’s financial performance for the year to the end of December. What it describes as geopolitical events particularly with regard to US import tariffs have resulted in higher than expected levels of market volatility, resulting in the strong second quarter.
 Meggitt MGGT Trading in quarter two has been stronger than expected with good growth across its Civil aftermarket and the military and energy markets. Organic revenue growth for the year in Military is now expected to between 6% – 8%, up from 3-5%whilst total oganic revenue growth is expected to rise to between 4 -6% instead of 2-4%
 Trakm8 Holdings plc TRAK reports very strong progress during the year to the end of March with revenue up by 12% and profit before tax by 69%. However revenue and profit for the first half of the current year are expected to be below those for the first half of 2018 the second half figures will be considerably better than last year leading to higher figures for the full year.
 Kromek Group KMK had another good year of growth in the 12 months to the 30th April,with revenue rising by 32% and the loss before tax falling from £3.8m to £2.5m. The customer base was developed and becoming EBITDA positive for the first time, making it a milestone year on the way to reaching cash flow break even and pre-tax profits.. The momentum has continued into the current financial year
Beachfront real estate for sale in Greece; http://www.hiddengreece.net
Ian Pollard – Next #NXT succumbs to High St woes
 NEXT NXT colder weather and a big rise in online sales helped Next to beat expectations for full price sales in the 54 days between 1st November and the 24th December, with a rise of 1.5% as against an expected fall of -0.3%. Within that figure however, retail sales were a disaster with a fall of 6.1% compared to a rise of 13.6% in online sales. Trading for the year as a whole, the 52 weeks to January 2018,was nothing less than disastrous with group profit before tax down by 8.3% slightly better than the expected 9.3%. For 2018 the decline is expected to continue albeit at a reduced rate as subdued consumer demand and a continued decline in real incomes continue to wreak havoc on the high street.
 Plus 500 PLUS expects revenue and profits for the year to the 31st December will be ahead of expectations after record revenues were achieved in the fourth quarter, as well as 246,000 new customers.
 Oncimmune ONC listed on AIM in May 2016 with its main aim being to enter the Chinese market with its early cancer detection test. The Chinese are heavy smokers and lung cancer deaths alone, now exceed 700,000 each year, due in part to late detection. Oncimmune’s test can detect cancer up to 4 years earlier than conventional methods and the company announced over Christmas that it has reached a distributorship deal with Genostics, a Hong Kong company which has acquired over 6 million shares in Oncimmune at a price of £1.56. Oncimmunes shares jumped to £1.29 yesterday, a rise of 23%
 December traffic statistics saw Wizz Air increase capacity by 19.4% and passengers by 19.8%, with load factor up slightly at 87.5%. Ryanair December traffic rose by 3% whilst load factor was up by 1% to 95%
Find beachfront villas & houses for sale in Greece; http://www.hiddengreece.net
WPP Uppish And Downish And Flat
 WPP plc WPP has seen a steady decline since the beginning of the year and the third quarter saw results which managed to be up and down at the same depending on which currency they are in. The year started with first quarter rises in sales and revenue of 4.8% and 3.6% respectively and ending in the third quarter with sales up by 0.9% and revenue down 1.1% on a like for like basis. For the nine months as a whole they were still up and down with revenue on a constant currency basis down 0.9% and constant currency sales up 1.7% or down 0.7% on a like for like basis. Not surprisingly the forecast for the year is that it will be neither up nor down but flat.
 Croda International CRDA constant currency sales grew by 4.4% for the third quarter to the end of September and by 4% for the year to date. Strong sales in personal care rose by 5.7% and helped to build on the first half recovery whilst geographically Latin America remained challenging but North America, Europe and Asia grew by 8%, 7% and 6% respectively.
 Weir Group WEIR expects to see strong growth in constant currency revenues and profits for the full year. Strong order growth continued into the third quarter with a rise of 21% headed by oil and gas which leapt by 59% Operating profit however will be slightly lower than previously indicated.
 Plus 500 PLUS believes that full year results will be ahead of market expectations after a record third quarter which saw revenue up by 50% and new customers by 69%. Over the nine months to date the revenue rise was 29%
 Earthport EPO The Chairman claims that 2017 was a good year with the loss after tax rising by 58% but adjusted gross profit up by 30% and adjusted EBITDA loss down by 58% thus establishing a solid platform for growth.
Luxury villas & houses for sale in Greece http://www.hiddengreece.net
Plus 500 Record Breaking Results And More To Come
 Plus 500 PLUS produced a strong performance with record breaking results significantly ahead of expectations, in the six months to the 30th June. Net profit rose by 104%, EBITDA by by 100% and earnings per share by 103%. Revenue rose by 19%. Including the share buy back programme returns to shareholders more than doubled, rising from $26.7m to $64.4m. Current trading continues to be strong and it is expected that results for the remainder of the year will continue to exceed market expectations, significantly.
 Telit Communications TCM plunged from a profit of $4.7m to a loss of $6.7m before tax in the six months to the 30th June. Revenue growth was hekd back by a number of factors including delays in the US certification of LTE poducts which is not now expected until quarter 3. Despite the delay the company still expects these to be strong growth drivers in the second half and remains confident of a strong performance but just to be on the safe side the interim dividend of 2.5 US cents per share is being abolished.
 Ultra Eectronics ULE Expects to see the year more heavily weighted than normal towards the second half following delays in the awarding of new contracts due to the UK general election and delays in the US budget being approved. First half revenue fell by 0.1% and underlying profit before tax by 0.2% but the interim dividend is being increased by 2.8%
 Filta Group Holdings FLTA updates that revenue growth in the six months to the 30th June has been in the region of 38% following strong performances in both the UK and the US. The first half has been substantially ahead of last year and further growth is expected throughout he remainder of the year.
Luxury villas & houses for sale in Greece – visit; http://www.hiddengreece.net
Continue buying Plus 500 (PLUS) – the trend continues to be our friend, says VectorVest
 Plus500 Ltd, (PLUS.L), formerly Investsoft Ltd., is an Israel-based company, which develops and operates online trading platforms for retail customers to trade contracts for difference (CFDs) internationally over more than 1,700 different underlying global financial instruments, comprising equities, exchange traded funds (ETF), foreign exchange, indices and commodities. The Company offers its service to retail customers in more than 50 countries via platforms across multiple internet and mobile operating systems.
FREE! For free VectorVest analysis on any stock, go to this link here

On June 2nd 2017, PLUS updated on trading update, and said the the positive trends outlined in the first quarter trading update issued on 26th April 2017 had continued. A further half-year trading update on July 3rd said that the business has continued to trade very strongly, and as a result, the Company now anticipates that revenues and profits for the year ending 31 December 2017 will be significantly ahead of current market expectations. CEO Asaf Elimelech said; “We have had a very successful half year, significantly ahead of our expectations. This puts us in a strong position for the remainder of the year. We are confident that our flexible business model will enable us to adapt to the upcoming regulatory changes and gives us a competitive advantage that will enable us to deliver another excellent performance this year.”
PLUS started appearing across key VectorVest metrics in December 2016, when the shares traded around 320p. While the well-documented regulatory challenges with financial authorities around the globe still sees a low RS (Relative Safety) rating of just 0.83 – poor on a scale of 0.00 to 2.00, the rate of recovery since the beginning of the year has seen the stock hit our current Value target of 578p per share for PLUS, indicating that at 596p it is currently fully. This only tells part of the story though: the RT (Relative Timing) indicator,which is a fast, smart, accurate indicator of a stock’s price trend, shows a rating of 1.55 for PLUS, which is excellent on a scale of 0.00 to 2.00.

The chart of Plus 500 is shown above where the share is on a VectorVest BUY recommendation. Over the past month the share has charted a triangular consolidation pattern and has gapped upwards out of the consolidation over the past two trading days. This gap (breakaway gap) usually precedes a strong move. Those holding the share should sit tight and consider adding to a winning position.
Summary: Since our April 26th note, PLUS has made dramatic progress from 468p and has hit our valuation of 578p. We repeat the view that PLUS has emerged from its not inconsiderable regulatory challenges in fine shape, and with an extremely bullish forecast for full year numbers. The valuation gap has now closed, but with the trend very much a friend in this case, the RT indicator shows that further progress from this point is likely. Aggressive traders who have experience in managing risk proactively should carefully consider this opportunity when they observe that the general market is positive.
David Paul
July 5th 2017
Readers can examine trading opportunities on PLUS and a host of other similar stocks for a single payment of £5.95. This gives access to the VectorVest Risk Free 5-week trial, where members enjoy unlimited access to VectorVest UK & U.S., plus VectorVest University for on-demand strategies and training. Link here to view.
FREE! For free VectorVest analysis on any stock, go to this link here
VectorVest Unisearch
On VectorVest a simple search using the Unisearch tool will quickly find shares that are undervalued with good fundamentals that have just issued a Buy recommendation. This will give the active trader a short list of many high probability trading opportunities each week. Traders now have the opportunity to spend five weeks discovering VectorVest’s unique simplicity, automation and independent guidance. Just £5.95 buys a 5 week trial to enable deep exploration, or how the system can assist in smarter trading in as little as 10 minutes a day. Powerful tools. Proven strategies. Unique Perspectives.
Link here for more info and to set up a trial.
European Financial Publishing Limited T/A VectorVest UK (VectorVest) is authorised and regulated by the Financial Conduct Authority under register number 543038. You should remember that the value of investments and the income derived therefrom may fall as well as rise and you may not get back the amount that you invest. Past performance is not a reliable guide to the future. This material is directed only at persons in the UK and is not an offer or invitation to buy or sell securities. If investors are in any doubt of the suitability of an investment given their individual circumstances, they are recommended to contact an investment manager or independent financial adviser who may be able to provide tailored advice. Opinions expressed whether in general or both on the performance of individual securities and in a wider economic context represent the views of VectorVest at the time of preparation. They are subject to change and should not be interpreted as investment advice. VectorVest and connected companies, clients, directors, employees and other associates, may have a position in any security, or related financial instrument, issued by a company or organisation mentioned on this site. European Financial Publishing Limited is a company incorporated in Scotland under Company Number SC357322 with its registered address at Exchange Tower, 19 Canning Street, Edinburgh EH3 8EH. Email: support@VectorVest.com
Photo-Me To Increase Dividend by 20%
 Photo-Me Intnl PHTM updates that the year to 30th April has been a year of excellent progress, with profit before tax expected to be at record levels after an increase of about 20% over 2016 which will enable the commitment to a 20% year on year rise in the ordinary dividend, to be met.
Investment in new products, growth of the laundry business, especially in Europe and that old friend, favourable currency movements, have all contributed to the success. The launch of the first ever laundrette in Japan, has proved to be a success.
Plus 500 Ltd. PLUS The positive trends evidenced in the first quarter have continued, Second quarter trading revenue has been stronger and margins have been maintained.
 Inmarsat plc ISAT has announced that Quatar Airways Airways has become the first Middle East megacarrier to select its advanced new GX Aviation in-flight broadband solution, which will be initially available on 130 aircraft