
Home » Posts tagged 'PFS'
Tag Archives: PFS
#HREE Harena Rare Earths PLC – Completion of Pre-Feasibility Study
 Harena Rare Earths Plc (LSE: HREE) (OTCQB: CRMNF), the rare earths company focused on the Ampasindava ionic clay rare earth project in Madagascar (the “Ampasindava Project“), is pleased to announce the highlights from its completed pre-feasibility study (“PFS“). The PFS represents an important advancement in the development of the Ampasindava Project, confirming its technical viability and providing a robust economic and operational framework to support the next phase of project progression.
The PFS was compiled by the Company with leading global engineering group SGS engaged to support technical inputs to the PFS and also to conduct an update of the 2023 Mineral Resource Estimate to JORC 2012 standard.
PFS HIGHLIGHTS
Robust technical and economic viability for long life heap leach operation
|
• |
Total rare earth oxide (TREO1) of ~71kt, over a measured 20-year life of mine (LOM) |
|
|
• |
Plant throughput set at 5Mtpa (dry) at average grade at 1,500 ppm TREO supported by independent metallurgical test work |
|
|
• |
Pre-production capital cost estimate of US$142 million, including 25% in EPCM (engineering, procurement and construction management) and funding costs |
|
|
• |
Annual TREO production estimate of 4,000 tonnes per year |
|
|
|
° |
Annual oxide (NdPr + DyTb) production of 1,700t per year (29,670t for 20 years) |
|
° |
Ratio of magnetic rare earth oxide (Magnet REO2) yielded to TREO despatched at 41% |
|
Excellent economic returns modelled using analyst sourced long term pricing
|
• |
Undiscounted LOM free cashflow of US$1.0 billion post-tax |
|
• |
Pre Tax NPV10 of US$343.7 million |
|
• |
Pre Tax IRR of 34% |
|
• |
Post Tax NPV10 of US$249.6 million |
|
• |
Post Tax IRR of 30% |
|
• |
Payback period of 4 years |
Outstanding financial metrics based on current publicly sourced consensus rare earth pricing
|
• |
Undiscounted LOM free cashflow of US$2.6 billion post-tax |
|
• |
Pre Tax NPV10 of US$616.1 million |
|
• |
Pre Tax IRR of 30% (Consensus pricing more optimistic in later years) |
|
• |
Post Tax NPV10 of US$464.3 million |
|
• |
Post Tax IRR of 27% |
|
• |
Payback period of 5 years |
Economic outcome summary
The Company has modelled the Ampasindava Project’s economics using two sets of rare earth oxide price forecasts. The base case uses a price deck sourced from a recognised Minerals Analyst for the years between 2025 and 2044. The Consensus Price deck is sourced using artificial intelligence (AI) applications that scrape web information on publicly available REO pricing forecasts between 2030 and 2049. In addition, the Company has modelled a situation, called Ampas Plus, using the base case price deck with a 10% reduction in opex and capex applied throughout.
|
Pre Tax 20 Yr NPV10 and IRR |
NPV10 |
IRR |
Payback |
|
|||
|
Base Case using Long-term Analyst Prices |
USD 349 m |
34% |
4 Yrs |
|
|||
|
Base Case using Current AI Consensus Prices |
USD 616 m |
30% |
5 Yrs* |
|
|||
|
Ampas Plus – Opex and Capex Savings |
USD 439 m |
41% |
3 Yrs |
|
|||
|
|
|||||||
|
Post Tax 20 Yr NPV10 and IRR |
NPV10 |
IRR |
Payback |
||||
|
Base Case using Analyst Prices |
USD 249 m |
30% |
3 Yrs |
||||
|
Artificial Intelligence Consensus Prices |
USD 464 m |
27% |
6 Yrs* |
||||
|
Ampas Plus – Opex and Capex Savings |
USD 327 m |
36% |
3 Yrs |
||||
* Consensus pricing more optimistic in later years
1. All references to Oxides are based on the contained level of those Oxides within the MREC product, noting the TREO contains La2O3 + CeO2 +Pr6O11 + Nd2O3 + Sm2O3 + Eu2O3 + Gd2O3 + Tb4O7 + Dy2O3 + Ho2O3 + Er2O3 + Tm2O3 + Yb2O3 + Lu2O3 + Y2O3
2. Magnetic Rare Earth Oxides (Magnetic REO) = Pr6O11 + Nd2O3 + Tb4O7 + Dy2O3
20 Year Prices forecast sourced from AI tools scraping web information on REO pricing forecasts
Ampasindava Project rapidly advancing and progressively de-risked
|
• |
Planning for a phased “Proof of Concept” plant at site is underway: |
|
|
|
° |
Initial establishment of a permanent on-site laboratory |
|
|
° |
Establishment of on-site test cribs and columns |
|
|
° |
Opportunity to optimise flowsheet and test downstream rare earth separation at a pilot scale |
|
• |
Selection of specialists to compile DFS and upgrade PFS to reduce cost and process risk |
|
|
• |
Commence targeted cost reduction and optimisation initiatives including: |
|
|
|
° |
Selection of high-grade zones for initial inclusion in mine plan |
|
|
° |
Optimising supply chain options |
Strong national government support
|
• |
Strong engagement with Malagasy national and regional governments |
|
• |
Environmental and social studies continue to support permitting and local validation |
|
• |
Permitting on track to allow construction to commence in 2027 |
|
• |
Social programs will focus on suitable and appropriate land compensation, job creation, education of youth, individual technical skills development, and local business creation and readiness |
Allan Mulligan, Executive Technical Director of Harena, said:
“The completion of the PFS represents a significant step forward for Harena and the Ampasindava Project. With significant previous investment in resource development, process testwork and environmental programs, we have an excellent understanding of the Ampasindava Project where we can now further optimise the asset as we move into the final piloting and studies phase.
The Ampasindava Project hosts a world-class scale ionic absorption rare earths mineralisation, particularly amenable to low cost and high yield recoveries. The sustainable and rapid remediation heap leach extraction model will serve to enhance the local, regional and national economy with no lasting impacts on the environment.
Our confidence in the results of the PFS and the underlying PFS process more broadly is based on the enormous previous works and current understanding of the orebody, and the inclusion of the Proof-of-Concept plant in 2026 will allow a smooth and organised mobilisation into construction with reduced start up risk.”
Ivan Murphy, Executive Chairman of Harena, said:
“We are extremely pleased to be releasing the excellent results of this pre-feasibility study to the market. The key metrics presented here clearly highlight the exceptional scale, quality and strategic significance of the Ampasindava Project, reinforcing its position as a world-class heavy rare earth asset and marking a major milestone in its progression towards development.
I would like to sincerely thank Allan Mulligan, our Executive Technical Director, for his dedication over the recent months, as well as the wider internal and external teams whose expertise and commitment have been instrumental in delivering this important result.”
SUMMARY REPORT
Introduction
Harena Rare Earths Plc is pleased to present the Pre-Feasibility Study (“PFS“) outcomes for its Ampasindava Rare Earth Ionic Clay Project (the “Ampasindava Project” or “Project“), located in the province of Antsiranana in north eastern Madagascar.
Harena has engaged leading global engineering group SGS to support technical inputs to the PFS and also to conduct an update of the 2023 Mineral Resource Estimate to JORC 2012 standard.
The compilation of the PFS has been internally managed by Harena. The initial study was conducted in order to meet regulatory requirements for the conversion of the Permit Research licence to a Permit Exploitation licence.
Several programs of metallurgical testwork were conducted by SGS and results emanating from several bulk sample leaching programs have been employed into the PFS design.
In line with international standards for feasibility studies, the PFS is generally in line with AACE Class 4 estimates and accuracy is in range of -30/+40. The planned on-site Proof of Concept demonstration plant will allow these estimates to be greatly enhanced and derisked.
Key PFS Outcomes and Assumptions
The PFS confirms the robust technical and economic viability for development of a mining and processing operation to produce a MREC product at the Ampasindava Project.
This has included:
|
• |
An updated global Mineral Resource Estimate of 606,000 tonnes of TREO with: |
|
|
|
° |
41kt of TREO in Measured Resources, |
|
|
° |
Indicated Resources of 156kt of TREO, and |
|
|
° |
Inferred Resources totalling 410kt of TREO. |
|
• |
The hand-sinking of 4,474 vertical test pits up to 10m deep, |
|
|
• |
Some 31,000 pit samples across the pedolith and saprolite areas of the pits, |
|
|
• |
A total of 277 vertical diamond drill holes, |
|
|
• |
Maximum head grades of 2.24% TREO and a global average of 868 ppm TREO, |
|
|
• |
Substantial metallurgical testwork with SGS and other consultants over several years of testing, including at least two bulk sample programs, |
|
|
• |
A range of yield payability favouring higher demand TREOs and resulting in a nett of 75%, and |
|
|
• |
The use of 3 to 4 concurrent satellite mining pits to ameliorate risk and optimise grade recovery. |
|
A summary of the physical and financial evaluation of the Project utilising a heap leach farm with a 5.0 Mtpa throughput rate is shown in Table 1 below. Additional details are set out below in the descriptive summary.
Table 1: Production Outcomes and Assumptions – Base Case
|
|
Parameter |
Unit |
Amount |
|
LOM |
Years |
20 |
|
|
LOM Feed |
M tonnes |
88 |
|
|
LOM Waste |
M tonnes |
13 |
|
|
LOM Strip Ratio |
Avg |
1:6 |
|
|
LOM TREO Head Grade (static model) |
ppm |
1,525 |
|
|
Total REO Feed |
k tonnes |
134.6 |
|
|
Total REO Production |
k tonnes |
71.1 |
|
|
Average REO Production |
k tonnes / annum |
3.5 |
|
|
Average TREO Payability |
% |
75 |
|
|
Total LOM Revenue |
US$M |
4,481.7 |
|
|
REO Revenue |
US$ / kg REO |
63 |
|
|
Magnet REO (NdPr + DyTb) Ratio in Conc. |
% |
42% |
|
|
Magnet REO Value in Conc. |
% |
93% |
|
|
Total LOM OPEX |
US$M |
2,743 |
|
|
OPEX, average |
US$M / annum |
137.1 |
|
|
OPEX, average |
US$ / tonne Ore |
31.3 |
|
|
OPEX, average |
US$ / kg REO |
38.5 |
|
|
CAPEX, upfront |
US$M |
142 |
|
|
CAPEX, ongoing |
US$M |
19 |
|
|
EBITDA |
US$M |
1,502 |
|
|
Free Cash Flow (Post Tax) |
US$M |
1,015 |
|
|
Net Present Value (Post Tax) (Real) 10% |
US$M |
249.6 |
|
|
Internal Rate of Return (Real, Unlevered) IRR |
% |
30 |
|
|
Payback |
Years |
4 |
Mineral Resource Estimate Detail
SGS was commissioned by Harena to review and restate the 2023 MRE in accordance with the guidelines of the JORC 2012 Code. The restated MRE issued by SGS (Camus, 2023) summarised below has an Effective Date of 1 November 2023:
The relevance of this resource supports many important project enablers. The fact it is an ionic clay resource leads to low capital and low operating cost metrics. Simple, cheap salt washing is all that is required to liberate the ionised adsorption bond of rare earth minerals from the gangue material they are held with.
Well-structured ionic clay deposits are rare and the deposit at the Ampasindava Project is as good as any from a global perspective.
Table 2. Mineral Resource Estimate for Ampasindava Project Deposit at Cut-Off of 500 ppm TREO
|
Classification |
Tonnage |
Volume |
Area |
Density |
Thickness (m) |
TREO |
MREO |
MREO / |
Contained |
Contained |
||
|
Total |
PED |
SAP |
||||||||||
|
Measured |
42.5 |
38.1 |
7.0 |
1.11 |
5.46 |
2.85 |
2.60 |
958 |
221 |
23% |
40,700 |
9,400 |
|
Indicated |
184.0 |
167.1 |
25.0 |
1.10 |
6.70 |
2.65 |
4.04 |
842 |
178 |
21% |
154,800 |
32,700 |
|
Measured |
226.5 |
205.3 |
31.9 |
1.10 |
6.43 |
2.70 |
3.73 |
863 |
186 |
22% |
195,500 |
42,100 |
|
Inferred |
472.0 |
429.1 |
78.9 |
1.10 |
5.44 |
2.71 |
2.73 |
870 |
189 |
22% |
410,500 |
89,000 |
|
Total |
698.5 |
634.3 |
110.8 |
1.10 |
5.72 |
2.71 |
3.02 |
868 |
188 |
22% |
606,000 |
131,100 |
|
1. |
The Mineral Resource Estimate (MRE) has an effective date of the 1st of November 2023. The Competent Person for the MRE is Mr. Yann Camus, P.Eng., an employee of SGS. |
|
2. |
The classification of the current Mineral Resource Estimate is consistent with the 2012 Australasian Code for Reporting of Exploration Results, Mineral Resources and Ore Reserves (the JORC Code). |
|
3. |
All figures are rounded to reflect the relative accuracy of the estimate and numbers may not add due to rounding. |
|
4. |
All Resources are presented undiluted and in situ, constrained within a 3D model, and are considered to have reasonable prospects for eventual economic extraction. |
|
5. |
Mineral resources which are not mineral reserves do not have demonstrated economic viability. An Inferred Mineral Resource has a lower level of confidence than that applying to an Indicated Mineral Resource and must not be converted to a Mineral Reserve. It is reasonably expected that the majority of Inferred Mineral Resources could be upgraded to Indicated Mineral Resources with continued exploration. |
|
6. |
Bulk density values were determined based on physical test work from each part of the deposit. |
|
7. |
The base cut-off grade (500ppm) TREO considers a mining cost of US$1.40/t mined, processing cost of US$8.00/t mined, and G&A cost of US$0.75/t mined. |
|
8. |
TREO = Y2O3+Eu2O3+Gd2O3+Tb2O3+Dy2O3+Ho2O3+Er2O3+Tm2O3+Yb2O3+Lu2O3+La2O3+Ce2O3+Pr2O3+Nd2O3+Sm2O3 |
|
9. |
MREO = Pr2O3+Nd2O3+Tb2O3+Dy2O3 |
|
10. |
The estimate of Mineral Resources may be materially affected by environmental, permitting, legal, title, taxation, socio-political, marketing, or other relevant issues. |
Important note:
The Company advises that the PFS is based on the JORC 2012 Mineral Resource Estimate, however, a Mineral Reserve has not yet been estimated. There is no certainty that further economic assessment will result in the eventual conversion of Mineral Resources to Ore Reserves or that the production target itself, assumptions used in the Study and resulting economic outcomes will be realised. The stated production target is based on the Company’s current expectations of future results or events and should not be solely relied upon by investors when making investment decisions. Further evaluation work and appropriate studies are required to establish sufficient confidence that this target will be met. Engineering studies and estimates including peer works support capital and operating cost estimates and are based on standard extraction and processing techniques. Non‐binding discussions are underway with interested parties for offtake of planned production. Discussions with third party infrastructure providers are underway. Extensive environmental baseline studies have been completed and no social, environmental, legal or regulatory impediments to development have been identified. The Pre-Feasibility Study is based on 100% of Measured and Indicated Resource. A Mineral Reserve has not been estimated at this time.
Project Design and Philosophy
The Ampasindava Project is a large-scale, long-life, REE Project in north eastern Madagascar. REE will be extracted from a 20 km long near surface ionic adsorption clay ore-body spanning the peninsular of Ampasindava in the province of Antsiranana in northern Madagascar. According to the PFS, commencing at 2.5 million tonnes treated per annum, by year 5, the Project will be processing 5 million tonnes of ionic adsorption clay ore through two process plant modules producing an estimated 4,000 tonnes of TREO despatched as 6,700 tonnes of mixed rare earth carbonate concentrate (MREC) at 60% per annum with an annual value of approximately US$250 million.
Some 88 million dry tonnes of ionic clay ore are expected to be processed, extracted and returned to the mine cavities over the 20+ year Project life. The Project is expected to deliver estimated gross royalty payments to Madagascar of US$220 million plus corporate tax contributions of US$320 million over its life based upon the existing JORC Mineral Resource Estimate (MRE) as of November 2023.
The proposed mining and processing sequence which is labelled “A rapid remediation, zero harm mining system”, returns neutral and non-toxic clays back to the mining cavity within a very short timeframe, allowing for land re-use or natural rehabilitation to occur. The system involves:
|
• |
Operating from 3 or 4 concurrent satellite mining pits within the mining zone |
|
• |
Removal and temporary storage of a 0.6m thick surface layer of topsoil that will be replaced following complete backfill of the mining pit |
|
• |
Removal of an average 5-6 metre layer of ionic-adsorption REE clay ore using truck and shovel and hauling this material to the process plant |
|
• |
Transport of the material to a ring-fenced leaching farm which is environmentally isolated from natural water courses and the effects of excessive rainfall |
|
• |
Agglomerating the ionic-adsorption REE clay to increase its permeability before placing it in 3m high stacks on top of an impermeable lining |
|
• |
Placing mobile irrigating pipe systems on the heaps |
|
• |
Desorbing the ionically adsorbed REE first into natural sea water and then into an ammonium sulphate lixiviant at pH 4 that is percolated through the clay-ore heap onto the HDPE liner which directs it to a process liquor pond |
|
• |
Concentrating the REE within the ammonium sulphate lixiviant via an ion exchange process in a nano filtration membrane circuit. This step will consequently produce large volumes of clean and neutral water that will be available for use as process water, dust control and irrigation of crops |
|
• |
Returning the “spent-ore” to the mining pit once the REE has been desorbed from the clay and residual ammonium sulphate has been washed out |
|
• |
Returning the overburden to the mining pit which in combination with the returned “spent-ore” will completely fill the mining void. |
The full mining, processing and rehabilitation cycle is expected to be about 3 months and the moving mining footprint will be similar to the area disturbed by 3 months of mining which will be between 10 and 15 hectares.
The Project will preferentially employ local people with the appropriate skills and qualifications over the life of the Project and expects that almost all the 400-person workforce will be Malagasy by Year 5. Adult skills training and a focus on education support will develop local capacity and facilitate employment of local people including women into technical and managerial roles with the Project.
A comprehensive Environmental and Social Impact Assessment (ESIA) of the Project is being undertaken in accordance with Office of Natural Environment (ONE) requirements and following IFC standard best practices. The social program and procurement strategy is based on the mantra – Local First, Regional Second and National and International Third. The intention is to create sources of income and wealth centres for local, impoverished Malagasy and secure a sense of local ownership of the Project. This inspires commitment, protection and self-interest to protect and uplift the project.
Process Recovery Methods
Ionic adsorption clay deposits are known for their relatively simple low capital processing arrangements. REE adsorbed onto clays are simply desorbed using an ion-exchange-based elution process with eluants such as sodium chloride or ammonium sulphate.
Ore is agglomerated at the ROM pad before being stacked in heaps of 80m width and 240m length on a sealed impervious layered heap foundation. There will be 26 of these heaps for a 5 Mtpa production cycle.
Heaps are 3m high but can sometimes be built higher to increase production. Drip irrigation is used to minimize evaporation, provide more uniform distribution of the leach solution, and avoid damaging the exposed mineral.
The solution then percolates through the heap and desorbs both the target and other minerals. This process, called the “leach cycle,” generally takes from less than one month for simple oxide ores. The leach solution containing the dissolved rare earths is then collected, treated in a simple process plant to recover the mixed rare earth as a carbonate product. The mother liquor, now rich in ammonium sulfate is recycled to the heap after reagent levels are adjusted. Ultimate recovery of the target mineral can range up to 80%
Heap leaching does not produce large tailings dams and the amount of overall environmental impact caused by heap leaching is often lower than more traditional techniques and is therefore more environmentally friendly. It also requires less energy consumption to use this method, which many consider to be an environmental alternative.
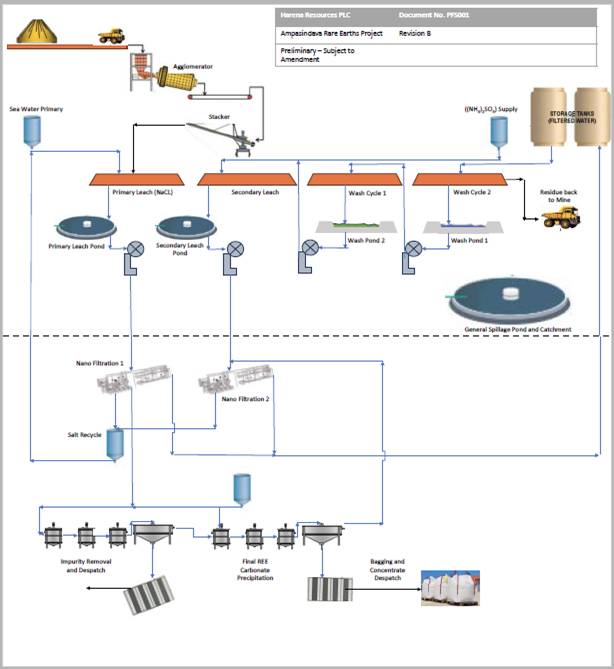
The indicative and conceptual process flow sheet is indicated below in Figure 1.
|
|
|
Figure 1. Conceptual Flow Sheet for the Ampasindava Project Heap Leach Ores |
Organisational Planning
The Ampasindava Project organisational chart is listed below in Figure 2. The organisational chart allocates operational responsibility amongst the functional contractors and service providers.
Each functional contractor and service provider will include their required personnel structures and staff numbers in the tender procurement process. This will allow the Company to scale the camp and personnel transport facilities accordingly.
|
|
|
Figure 2. Organisational Structure of Mine Operations |
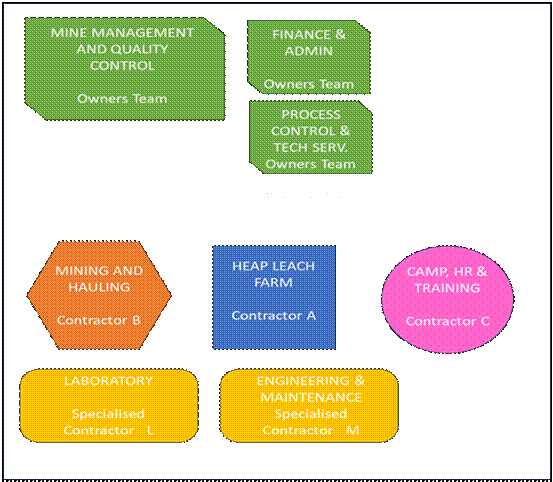
The fully-outsourced procurement model is functionally attractive for the construction and operation of remote mining operations. The specialist engineering and operations are left to functional experts and owner’s mine management can oversee and focus on the core mineral beneficiation function.
It is expected that at least 50% of the mine personnel will live in private accommodation in villages nearby.
Capital and Operating Costs
The capital cost estimate is broken down into the main areas of infrastructure, camp and offices, mining and processing plant and associated project costs, as shown in Table 3. The mining capital cost estimate was developed by Harena with input from contract mining service providers elsewhere in Africa and the general and plant capital cost estimate was developed by first order assessments from other projects located globally.
The capital estimate is subject to a study upgrade where the PFS will be enhanced to definitive level and the capital estimates will be supported by design criteria and a higher level of supplier enquiries and quotes.
Table 3. Ampasindava Project summary of CAPEX breakdown (in US$M).
|
Breakdown |
Area |
Est |
USDm |
|
|
Management |
Owners Cost |
Budget |
3.0 |
|
|
Design and Build |
Est % |
18.0 |
||
|
Funding Cost and Fees |
Est |
9.0 |
||
|
Contingency |
Total % |
4.0 |
||
|
Mining Fleet |
Mixed Plant |
Est |
8.5 |
|
|
Heap Farm & Process |
Earthworks and Engineering |
Est |
7.0 |
|
|
Leaching Infrastructure |
Eng |
10.1 |
||
|
Power and Water |
Est |
14.0 |
||
|
RO and Nano Filtration |
Est & Quote |
60.0 |
||
|
Other Infrastructure |
Roads and Camp |
Est |
5.2 |
|
|
Water Borne and Other |
Est |
0.8 |
||
|
Communication and FIFO |
Est |
2.7 |
||
|
Total |
|
|
142.34 |
|
|
Ongoing |
|
|
19.00 |
|
|
Total LOM
Closure Costs |
|
Est |
161.39
14.5 |
|
The operating cost estimates were developed in loose collaboration with mining contractors from other African projects, engineering consultants in Australia and other local cost indexes.
The operating costs were prepared using the WBS and some equipment lists generated for the project. These estimates were prepared in US$.
Table 4. A summary of the operating costs estimate broken down into respective components.
|
OPEX Breakdown |
LOM OPEX US$m |
Average Annual OPEX, US$m |
Average OPEX, US$/kg REO |
Average OPEX, US$/tonne ROM |
% of Total |
|
Mining |
844.8 |
42.2 |
11.5 |
9.6 |
30.8 |
|
Processing |
1,050.6 |
52.5 |
14.7 |
11.9 |
38.3 |
|
Other Direct Costs |
499.5 |
25.1 |
7.0 |
5.7 |
18.3 |
|
Overhead |
343.9 |
19.2 |
4.8 |
3.9 |
12.6 |
|
TOTAL |
2,743 |
136.9 |
38.5 |
31.1 |
100 |
1.14 Manning and Personnel
It is intended to source skilled and semi-skilled staff under the following guiding principles:
|
• |
Local First, |
|
• |
Regional Second, |
|
• |
National Third, and |
|
• |
International only for highly specialised and temporary assignments. |
The Paterson system of job ranking will be used and there will be no discrimination on the basis of gender, age, race or disability. Thus, all appointments will be merit based.
Approximately only 8 Expatriate Staff will be forecast to work at the operation during the initial years. These will be specialist Process and Engineering skills that will assist in reaching the demanding production rate of 5 million tonnes processed per annum.
On the job training and skills development of Malagasy professionals will allow these expatriate employees to retreat. Most staff will be encouraged to live in nearby towns and establish localised homes and encourage a family working environment.
Table 5. Operational Manning Estimate
|
Functional Element |
Number |
Owner |
|
Owners Management |
10 |
Owner |
|
Mining |
169 |
Contractors plus |
|
Processing |
62 |
Owner/Contractor |
|
Engineering |
66 |
Contractor |
|
SHEC |
42 |
Contractor |
|
Admin |
29 |
Contractors |
|
Total |
378 |
Please refer to the PFS announcement available on Harena’s website for an Employment Organigram for the Ampasindava Project Rare Earth Mine.
Next Steps – Proof of Concept Plant
The critical next step for all leach operations is the test and proof that the design process operates under ambient conditions in the field adjacent to the mineral source. Harena plans to permit and construct a Proof of Concept (PoC) plant at the mine processing site. This exercise will take approximately 9 months and will operate for as long is necessary to provide de-risked operating confirmation of the process and leach lixiviant requirements, the environmental outcomes and the economic and technical viability of the planned operation.
Following successful deployment of the PoC, the Company will move to further design and a Decision to Mine which would launch construction and project activities proper.
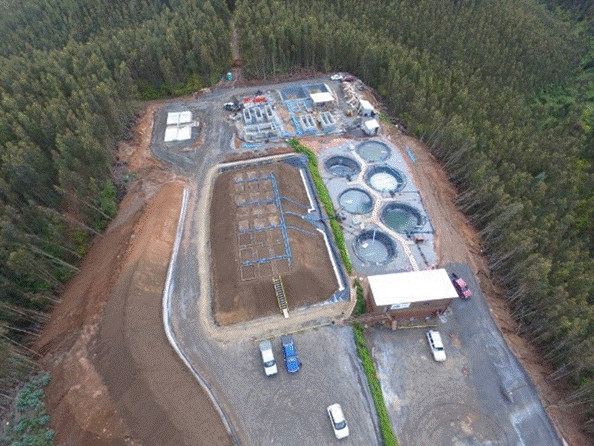
The image below in Figure 3 is a representative Project in Chile but is a good representation of a Proof of Concept heap leach and recovery mine plant. It appears that about 5,000 to 6,000 tonnes was heap leached here.
|
|
|
Figure 3. Representative image of a PoC plant operating in Chile |
Project planning for the PoC project includes the following steps:
The Company wishes to fast-track progress on the Proof of Concept Plant. Validation of an in-house metallurgical design flowsheet is essential for funding and market confidence. This process can take up to 12 months or more depending on results achieved.
The PoC plant development process will be staged. The first stage will be as follows:
|
1. |
Mining Permit for Extraction; |
|
2. |
Interim environmental approval from ONE; |
|
3. |
Social and regional approvals and acknowledgement from local stakeholders; and |
|
4. |
Construction commences to facilitate permanent laboratory. |
The process to be followed will be:
|
• |
Building of a life of mine shed at site which will accommodate suitable numbers of columns, small cribs and then larger cribs to be acquired in country; |
|
• |
Diesel power supply for lighting, pumps and fans; |
|
• |
Cement mixer type agglomerator and hand held material handling; |
|
• |
Suitable starter laboratory such that the works can be measured and assessed; |
|
• |
Small salts storage and mixing area with appropriate ventilation and handling facilities; |
|
• |
Small office and ablutions to provide support; and |
|
• |
Fit for purpose communications infrastructure. |
Based on success achieved operating the on-site facility, the PoC will be expanded into the main facility immediately upon activation thereof. This will be termed stage 2. The process to be followed will be:
|
a. |
Appointment of the technical team to lead mining, leaching and recovery. |
|
b. |
Brief level 1 design of the PoC mine and limited infrastructure – much can be disposable. |
|
c. |
Individual scopes of work for 4 packages representing the four areas of operation. These should reflect a minimalistic approach for limited services. |
|
d. |
Approval of program and budget from Ionic RE Executive. |
|
e. |
Submission of Environmental Amendment to ESIA. |
|
f. |
Follow on application to Mines Department for exemption to commence on small scale. |
|
g. |
Regulatory approval/exemption from Ministry. |
|
h. |
Procurement Inquiries to approved vendors for equipment and services as required. |
|
i. |
Procurement request for Interest on various contract works with local approved construction and engineering and earthworks companies. |
|
j. |
Communication and relocation of limited affected persons. |
|
k. |
Contractor approval and execution of main two contractors for primary construction, power supply, water and other services including base temporary roads. |
|
l. |
Operational plan from same two contractors, if possible. |
|
m. |
Development of technical and management control systems for Rwenzori RM and Ionic RE. |
|
n. |
Mobilisation to site and commencement of 1st pad and temporary infrastructure. |
Schedule
Initial planning for the demo plant to have completed its purpose was set at a time period of 240 days. Contingent issues affecting the schedule are:
|
• |
Effective planning and adequate scope inclusions; |
|
• |
Permissions from the Ministries and the possible need for exemptions/deferrals; |
|
• |
Logistic solutions and regulatory impacts; |
|
• |
Long Lead Time items, such as the RO plants and other, and |
|
• |
Re-iterations and the ease with which these can be commenced.
|
Budget for PoC
The budget for the demo plant currently stands at US$11.5m to be spent after award of the Mining Permit Exploitation and the rising of capital to construct.
The major cost unknown is not the construction cost and this amount may be adequate. However, the duration of operation of the PoC mine could require significant contingent provisions.
The approach would be that if an early enough confidence can be achieved with the initial 90 days plus 30 days operation of the leach pad and assuming that regulatory licences have been issued, an opportunity is created for an accelerated build of the mine can be commenced, making the extended operation of the PoC mine much more acceptable and somewhat more cost effective.
Please refer to the PFS announcement available on Harena’s website for a summary of the budget for Proof of Concept Construction Capital.
Permitting
The conversion of a mining exploration licence (PR) to a mining exploitation licence (PE) in Madagascar is primarily governed by Law No. 2023-007 (New Mining Code). This process is managed by the Bureau du Cadastre Minier de Madagascar (BCMM) under the authority of the Ministry of Mines.
Current requirements for conversion (transformation) include:
Environmental and Social Compliance
|
• |
Environmental Impact Study (EIE); |
|
• |
Social Responsibility Plan (PRSE): Applicants must submit a plan for social responsibility and contribute to the Mining Fund for Social and Community Investment (FMISC); and |
|
• |
Environmental Rehabilitation Plan. |
Technical and Financial Requirements
|
• |
Pre-Feasibility Study; |
|
• |
Cahier des Charges Minières (CCM): Every permit must include a specifications book detailing specific technical and financial obligations; and |
|
• |
Workforce Requirements |
Legal Status and Tenure
Eligibility where the applicant must be a legal entity registered under Malagasy law. Under the new code, a PE is valid for 25 years, renewable once for 15 years (reduced from the previous 40-year term). The permit holder must secure a lease agreement or prior agreement from the landowner for surface rights.
Applications for transformation are currently being processed by the BCMM following the lift of a previous moratorium, though a ministerial order from the Minister in charge of Mines is still required for each final approval.
Pricing Assumptions and Forecast Methodology
The economic model has been developed using long term pricing from a recognised market analyst and Artificial Intelligence forecast consensus pricing.
The base case economic indicators have been derived using the market analyst pricing which has been developed prior to the recently highly publicised interventions into the Rare Earths market by an alliance of Western Nations concerned by the dominant position of China in the processing and refining of these products.
In regard to the different forecasts for the magnet metals, prices forecast by AI are Nd (1/3rd), Pr (1/3rd), Dy (2/3rds) and Tb (1/3rd) higher than the more conservative and earlier forecast by the market analyst.
These forecasts are underpinned by open-sourced comprehensive analysis of global supply and demand trends. On the demand side, projections reflect anticipated growth in key sectors such as electric vehicle drive-trains, wind turbines, energy transition technologies, robotics, and particular military defence applications. Supply assumptions incorporate current global production levels and publicly announced future projects, offering a well-rounded view of the evolving market.
Sensitivity Analysis
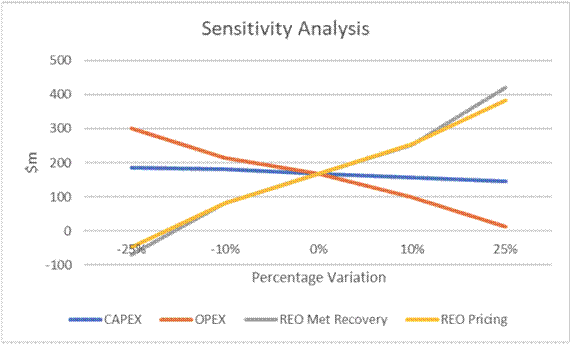
A sensitivity analysis was performed for the Project, highlighting its resilience to variations in capital costs, operating costs, REO recoveries and Prices.
The results of the sensitivity analysis variable intervals of +10%/-10% is indicated in the graph below, highlighting that the Project is particularly sensitive to REO prices received and metallurgical recoveries. This would imply that particular care will be taken during the operations of the afore-mentioned Proof of Concept plant to optimise these recoveries, even at the expense of some extra cost inputs.
|
|
|
Figure 4. Ampasindava Project Sensitivity Analysis for base case conditions. |
Forward Work Program
The forward work program has been allocated to three distinct estimated time related milestones.
|
Award of Mining Licence and further permitting requirements |
Q1 2026 |
|
Operations of Proof of Concept Plant and feed results into final design parameters |
Q2 2027 |
|
Detailed design and Financial Investment Decision (FID) |
Q4 2027 |
The Company has developed a Joint Roadmap to production as a communication and planning tool for the Project and financial stakeholders. The stakeholders of the Project have been identified as:
|
• |
Members of Harena Rare Earths PLC and investors; |
|
• |
Government of Madagascar in many regulatory and fiscal forms; |
|
• |
Local residents and stakeholders at the mine site and regionally; |
|
• |
Employees of various group companies; |
|
• |
Contractors and service providers; |
|
• |
Customers, other clients and buyers; and |
|
• |
Other interested Governments and product beneficiaries. |
Please refer to the PFS announcement available on Harena’s website for the Ampasindava project process flow mapping.
Material Assumptions and Outcomes
The PFS was completed with the following material assumptions:
|
• |
Clay winning will be via several (up to 5) satellite pits operating simultaneously and sharing the mining and trucking fleet. |
|
• |
Ore to be excavated through conventional mobile machine operations and trucked to the heap leach farm. No requirement for blasting. |
|
• |
Topsoil will be stockpiled in accessible piles near the mining area so it can be used for rehabilitation once a section of the pit has been backfilled and contoured to final landform. |
|
• |
The processing heap leach farm will be 5.2 Mtpa and the monthly requirement for material movement will on average be 280,000 cubic metres (bcm) of mineralised clay per month. An additional 35,000 bcm of topsoil and waste is to be moved and stored near the pits each month. |
|
• |
The mine grade has been assumed to be 75% of the average of two bulk samples excavated from the orebody. This aligns with a concerted effort to selectively mine high-grade areas of the orebody. |
|
• |
Overall metallurgical yield has been calculated at 53% TREO. Individual oxide elemental recoveries have been applied as per the test work results. |
|
• |
Revenue is based on individual REO prices as supplied by the market analyst multiplied by individual oxide recoveries. These values reflect gross forward looking revenue streams. An individual payability factor per metal is assumed where higher value/demand products can negotiate better differential payabilities. The highest payability assumed is 80% for Gd2O3 and the lowest is 40% for CeO2. The average basket payability achieved is 75%. |
|
• |
The economic model is denominated in US dollars (USD). |
|
• |
Transportation charges for MREC is estimated at $200/tonne concentrate shipped. Transport charges ex-Madagascar to the separation plant customer have been reflected within the estimated payability factor. |
|
• |
A mine life of 20 years has been assessed for practicality. The African, remote location has meant a discount factor 0f 10% has been used. The tax rate is 20% and the royalty rate is 5% of gross value. |
|
• |
Generally, sea-borne logistics will be used for off-mine transport and supplies/delivery of equipment. Air-borne logistics will be used for personnel travel outside the mine region. |
|
• |
Power consumption is moderate, at about 4MW and will be provided by hybrid solar supported by diesel generation. |
|
• |
Mine plant will initially be contractor owned with a support facility for local truck driver economic aide to purchase mine spec trucks and provide contract deliveries to the heap leach farm. |
|
• |
Camp operations will be outsourced, including the capital and construction. |
Material Modifying Factors
The following modifying factors were considered in relation to the assessment of this PFS:
Location
The Ampasindava Project is located in the eastern part of the Ampasindava Peninsula, Antsiranana Province on the northwest coast of Madagascar, approximately 500 km north of Madagascar’s capital city Antananarivo. The nearest major town and administrative centre of the region is called Ambanja and is located some 40 km to the northeast of the project area.
The PFS area has ample land for mine development, processing infrastructure, and future expansions.
The proposed pits and processing facility will be well-connected via a network of paved roads and private gravel roads, facilitating efficient ore transport. The entire mine zone and proposed heap leach farm will be within 10kms of each other.
Power Supply
Power is not readily available in the project area from the national grid. Power at the mine site, expected to require some 6MW, will be supplied by diesel generator units and supplemented by solar installation and battery storage for low critical applications.
The Company will supply the electrical generator equipment for the heap leach processing plant and a 11kV main substation including 2 incomer circuit breakers. In addition, diesel tanks, pump and piping from the tank to the gensets as well as the paralleling and synchronisation control system.
Generator specifications KH-1000GF set 6 Including diesel boxes, generator control units and 400V switchgear. Also installed will be a DMC 1500 power command paralleling system to balance loads from the power plant.
Water Supply and Management
The Project will incorporate advanced water recycling technologies, including ultrafiltration and reverse osmosis (RO) systems, to minimise freshwater consumption and ensure minimal industrial effluent discharge. Freshwater is available through on-site bores. Sea water is abundant and nearby as the project is within 3km of the coast. The ore beneficiation process is designed for high water efficiency, with >75% of process water recirculated within the plant.
Water consumption for the Ampasindava Project is expected to be low. This basis is derived from:
|
• |
Net positive water balance of the process; |
|
• |
The project areas high annual rainfall; |
|
• |
The process arrangement using heap leaching and maximised water recycling using membrane technology for reagent recovery, resulting in fresh water recovery; and |
|
• |
Given the low forecast water consumption, it is proposed that water for both processing operations and dust management is to be sourced by water harvesting ponds on site and from the mining pit. |
During periods of extended dry weather, it is proposed that water could be sourced from boreholes up to 10km from the project area, although local groundwater resources potentially also a source, however, limitation on drawing from local groundwater could limit this option.
Labour and Accommodation
The operation is to be staffed by a residential workforce. No fly in – fly out other than specialised technical and management skills is envisaged and the number of expatriates staff is intended to be low, and to be being phased out over the first 7 years of operations.
The region is poverty stricken and there is no shortage of unskilled and semi-skilled labour. A workforce of semi-skilled and artisanal workers is available in nearby townships and population centres. The closest major population centre is Ambanja, which has a population of 50,000.
The township of Anjiabory is approximately 10km from the project site and the intent is to source local operations staff from the immediate districts and train staff accordingly.
Environmental
The Company has submitted seven environmental monitoring reports. These reports were completed in order to be compliant to the regulation of the Office National de l’Environnement (ONE) and the Ministry of Mines of Madagascar.
From the point of view of environmental considerations, no sensitive area has yet been established within the exploration license for the period. However, the northeastern part of that exploration license, and an area of approximately 100 km2, is located in a priority area for the establishment of protected areas.
The environmental and social programs will strive to meet international IFC standards.
For further information please contact:
|
Harena Rare Earths Plc Ivan Murphy, Executive Chairman Allan Mulligan, Executive Technical Director
|
+44 (0)20 7770 6424
|
|
SP Angel – Joint Broker Ewan Leggat / Josh Ray (Corporate Finance)
|
+44 (0)20 3470 0470 |
|
Marex Financial – Corporate Advisor Angelo Sofocleous / Keith Swann / Matt Bailey (Broking) |
+44 (0)20 7655 6000 corporate@marex.com |
|
Allenby Capital – Financial Adviser & Joint Broker Jeremy Porter / Vivek Bhardwaj (Corporate Finance) Amrit Nahal / Kelly Gardiner (Sales & Corporate Broking) |
+44 (0)20 3328 5656 info@allenbycapital.com |
|
Muriel Siebert & Co. – US Financial Adviser & Broker Ajay Asija, Co-Head of Investment Banking |
+1 (917) 902 7823 aasija@siebert.com |
|
Celicourt Communications – Public Relations Mark Antelme / Charles Denley-Myerson |
+44 (0)20 7770 6424 harena@celicourt.uk |
#AYM Anglesey Mining PLC – Half yearly report for the six months to 30 September 2025
 Chairman’s Statement and Management Report
During the half year period, we were pleased to publish a conceptual study of a high-density fluid hydro-power energy storage project at the mine.
The findings of the conceptual study led to the commencement of a pre-feasibility study (PFS) in the energy storage scheme and we have published the proposed operational methodology and revenue streams associated with the project in terms of both Long Duration Energy Storge (LDES) and how that might be the catalyst for the commencement of mining of the Parys Mountain VMS mineral deposits.
Our investigations show there is a positive business case for the energy project on a standalone basis, that the risks identified thus far can be reasonably overcome or mitigated. Elements of the energy storage project scope, for example: the de-watering and refitting of the Morris shaft for material and personnel hoisting, the dewatering of the workings emanating from the Morris shaft 280m below the surface, the upgrading of the power-line to site, the on-going environmental and social studies and the deployment of impact avoidance, mitigation and compensation strategies, are each synergistic with the first steps of establishing a modern underground mine on Parys Mountain.
It is an essential and clear intent of the energy project that Anglesey Mining retains all the optionality that it currently has for the construction and commissioning of an underground mine, and that the hydro energy pumped storage project should not detract from those options over the medium and long term.
In the period to the 30th September 2025, we unfortunately had to announce the termination of our management rights and obligations over Grangesberg Iron AB (GIAB). Under a shareholders’ agreement our 100% owned subsidiary, Angmag AB, and therefore Anglesey Mining, had management rights with the ability to appoint the majority of the Board of GIAB. The Agreement had an initial term of 10 years from 28 May 2014, extendable on a year-to-year basis, unless terminated on one year’s notice. On 28 May 2024, Eurmag AB, which holds the remaining 50.2% of GIAB, gave notice of termination of the Agreement.
As at 31 December 2024, GIAB had loans outstanding to its senior debt holder of approximately US$9.0 million. Despite the best efforts of the Company, revised terms and conditions for the senior debt could not be arrived at such that the Board of Anglesey Mining could then explore the raising of funds to facilitate a settlement of this debt and therefore management of GIAB reverted to Eurmag AB, GIAB’s 50.2% shareholder, with Anglesey retaining its 49.8% ownership interest.
Post the end of the half year period, on 5 December 2025 the Company announced that it had entered into a binding letter of intent with its largest shareholder and largest creditor Energold Minerals Inc. whereby Anglesey will eliminate approximately £4 million of debt in exchange for its interest in GIAB and holding of Labrador Iron Mines Holdings Limited, reducing total outstanding debt to approximately £100,000.
Energold has also provided immediate funding to Anglesey of £350,000 through the purchase of non-voting exchangeable warrants.
The Board believes that the restructuring of the Company’s balance sheet, in addition to the investment of fresh funds by Energold, will place the Company in a materially stronger position from which to pursue its primary objective of advancing Parys Mountain.
Finally, at the beginning of December 2025, we were delighted to welcome Brendan Cahill and Jim Williams to Anglesey’s board.
Financial
The group had no revenue for the period. The loss for the six months to 30 September 2025 was £334,699 (2024 comparative period £311,052) and expenditure on the mineral properties in the period was £50,955 compared to £125,479 in the same period in 2024.
Net current liabilities as at 30 September 2025 were £370,085 compared to net current liabilities of £182,582 at 31 March 2025.
Andrew King
Chairman
19 December 2025
Unaudited condensed consolidated income statement
| Notes | Unaudited six months ended 30 September 2025 | Unaudited six months ended 30 September 2024 | ||
| All operations are continuing | £ | £ | ||
| Revenue | – | – | ||
| Expenses | (236,591) | (213,575) | ||
| Equity-settled employee benefits | – | (4,230) | ||
| Investment income | 883 | 2,169 | ||
| Finance costs | (98,957) | (95,384) | ||
| Foreign exchange movement | (34) | (32) | ||
| Loss before tax | (334,699) | (311,052) | ||
| Taxation | 8 | – | – | |
| Loss for the period | 7 | (334,699) | (311,052) | |
| Loss per share | ||||
| Basic – pence per share | (0.1)p | (0.1)p | ||
| Diluted – pence per share | (0.1)p | (0.1)p | ||
Unaudited condensed consolidated statement of comprehensive income
| Loss for the period | (334,699) | (311,052) | ||
| Other comprehensive income | ||||
| Items that may subsequently be reclassified to profit or loss: | ||||
| Change in fair value of investment | 14 | (449,562) | 388,683 | |
| Foreign currency translation reserve | 13,912 | 17,654 | ||
| Total comprehensive (loss) for the period | (770,349) | 95,285 | ||
All attributable to equity holders of the company
Unaudited condensed consolidated statement of financial position
| Notes | Unaudited 30 September 2025 | 31 March 2025 | ||
| £ | £ | |||
| Assets | ||||
| Non-current assets | ||||
| Mineral property exploration and evaluation | 9 | 17,043,457 | 16,992,502 | |
| Property, plant and equipment | 204,687 | 204,687 | ||
| Investments | 10 | 777,119 | 1,226,681 | |
| Deposit | 129,727 | 128,857 | ||
| 18,154,990 | 18,552,727 | |||
| Current assets | ||||
| Other receivables | 35,358 | 36,988 | ||
| Cash and cash equivalents | 43,791 | 44,264 | ||
| 79,149 | 81,252 | |||
| Total assets | 18,234,139 | 18,633,979 | ||
| Liabilities | ||||
| Current liabilities | ||||
| Trade and other payables | (449,234) | (263,834) | ||
| (449,234) | (263,834) | |||
| Net current liabilities | (370,085) | (182,582) | ||
| Non-current liabilities | ||||
| Loans | (4,231,211) | (4,046,102) | ||
| Long term provision | (50,000) | (50,000) | ||
| (4,281,211) | (4,096,102) | |||
| Total liabilities | (4,730,445) | (4,359,936) | ||
| Net assets | 13,503,694 | 14,274,043 | ||
| Equity | ||||
| Share capital | 11 | 10,359,056 | 10,359,056 | |
| Share premium | 12,910,853 | 12,910,853 | ||
| Currency translation reserve | (68,797) | (82,709) | ||
| Retained losses | (9,697,418) | (8,913,157) | ||
| Total shareholders’ funds | 13,503,694 | 14,274,043 | ||
All attributable to equity holders of the company
Unaudited condensed consolidated statement of cash flows
| Notes | Unaudited six months ended 30 September 2025 | Unaudited six months ended 30 September 2024 | ||
| £ | £ | |||
| Operating activities | ||||
| Loss for the period | (334,699) | (311,052) | ||
| Adjustments for: | ||||
| Investment income | (883) | (2,169) | ||
| Finance costs | 98,957 | 95,384 | ||
| Share based payments charge | – | 4,230 | ||
| Foreign exchange movement | 34 | 32 | ||
| (236,591) | (213,575) | |||
| Movements in working capital | ||||
| Decrease/(increase) in receivables | 1,630 | 9,385 | ||
| Increase in payables | 182,627 | 4,041 | ||
| Net cash used in operating activities | (52,334) | (200,149) | ||
| Investing activities | ||||
| Investment income | 13 | 3 | ||
| Mineral property exploration and evaluation | (48,118) | (274,755) | ||
| Net cash used in investing activities | (48,105) | (274,752) | ||
| Financing activities | ||||
| Issue of share capital | – | 567,750 | ||
| Movements on loans | 100,000 | (29,207) | ||
| Net cash generated from financing activities | 100,000 | 538,543 | ||
| Net increase in cash and cash equivalents | (439) | 63,642 | ||
| Cash and cash equivalents at start of period | 44,264 | 219,685 | ||
| Foreign exchange movement | (34) | (32) | ||
| Cash and cash equivalents at end of period | 43,791 | 283,295 | ||
All attributable to equity holders of the company
Unaudited condensed consolidated statement of changes in group equity
| Share capital £ |
Share premium £ |
Currency translation reserve £ |
Retained losses £ |
Total £ |
|
| Equity at 1 April 2025 – audited | 10,359,056 | 12,910,853 | (82,709) | (8,913,157) | 14,274,043 |
| Total comprehensive loss for the period: |
|||||
| Loss for the period | – | – | – | (334,699) | (334,699) |
| Change in fair value of investment | – | – | – | (449,562) | (449,562) |
| Exchange difference on translation of foreign holding |
– | – | 13,912 | – | 13,912 |
| Total comprehensive loss for the period |
– | – | 13,912 | (784,261) | (770,349) |
| Shares issued | – | – | – | – | – |
| Share issue expenses | – | – | – | – | – |
| Equity-settled employee benefits | – | – | – | – | – |
| Equity at 30 September 2025 – unaudited |
10,359,056 | 12,910,853 | (68,797) | (9,697,418) | 13,503,694 |
| Comparative period | |||||
| Equity at 1 April 2024 – audited | 9,711,764 | 12,963,103 | (89,589) | (8,097,527) | 14,487,751 |
| Total comprehensive loss for the period: |
|||||
| Loss for the period | – | – | – | (311,052) | (311,052) |
| Change in fair value of investment | – | – | – | 388,683 | 388,683 |
| Exchange difference on translation of foreign holding |
– | – | 17,654 | – | 17,654 |
| Total comprehensive loss for the period |
– | – | 17,654 | 77,631 | 95,285 |
| Shares issued | 635,000 | – | – | – | 635,000 |
| Share issue expenses | – | (67,250) | – | – | (67,250) |
| Share issue expenses | – | – | – | 4,230 | 4,230 |
| Equity at 30 September 2024 – unaudited |
10,346,764 | 12,895,853 | (71,935) | (8,015,666) | 15,155,016 |
All attributable to equity holders of the company
Notes to the accounts
1. Basis of preparation
This half-yearly financial report comprises the unaudited condensed consolidated financial statements of the group for the six months ended 30 September 2025. It has been prepared in accordance with the Disclosure and Transparency Rules of the Financial Conduct Authority, the requirements of IAS 34 – Interim financial reporting (as adopted by the UK) and using the going concern basis. The directors are not aware of any events or circumstances which would make this inappropriate. It does not constitute financial statements within the meaning of section 434 of the Companies Act 2006 and does not include all of the information and disclosures required for annual financial statements. It should be read in conjunction with the annual report and financial statements for the year ended 31 March 2025 which is available on request from the company or may be viewed at www.angleseymining.co.uk/accounts.
The financial information contained in this report in respect of the year ended 31 March 2025 has been extracted from the report and financial statements for that year which have been filed with the Registrar of Companies. The report of the auditors on those accounts did not contain a statement under section 498(2) or (3) of the Companies Act 2006 and was not qualified. The half-yearly results for the current and comparative periods have not been audited or reviewed by the company’s auditor.
2. Significant accounting policies
The accounting policies applied in these unaudited condensed consolidated financial statements are consistent with those set out in the annual report and financial statements for the year ended 31 March 2025. There are no new standards, amendments to standards or interpretations that are expected to have a material impact on the group’s results.
The group has not applied certain new standards, amendments and interpretations to existing standards that have been issued but are not yet effective. They are either not expected to have a material effect on the consolidated financial statements or they are not currently relevant for the group.
3. Risks and uncertainties
The principal risks and uncertainties set out in the group’s annual report and financial statements for the year ended 31 March 2025 remain the same for this half-yearly period. They can be summarised as: development risks in respect of mineral properties, especially in respect of permitting and metal prices; liquidity risks during development; and foreign exchange risks. More information is to be found in the 2025 annual report – see note 1 above.
4. Statement of directors’ responsibilities
The directors confirm to the best of their knowledge that:
(a) the unaudited condensed consolidated financial statements have been prepared in accordance with the requirements of IAS 34 Interim financial reporting (as adopted by the UK); and
(b) the interim management report includes a fair review of the information required by the FCA’s Disclosure and Transparency Rules (4.2.7 R and 4.2.8 R).
This report and financial statements were approved by the board on 19 December 2025 and authorised for issue on behalf of the board by Andrew King, interim chairman and Rob Marsden, chief executive officer.
5. Activities
The group is engaged in mineral property development and currently has no turnover. There are no minority interests or exceptional items.
6. Earnings per share
The loss per share is computed by dividing the loss attributable to ordinary shareholders of £0.3 million by 484 million – the weighted average number of ordinary shares in issue during the period. The comparative figures were a loss to 30 September 2024 of £0.3m divided by 442 million shares. However where there are losses the effect of outstanding share options is not dilutive.
7. Business and geographical segments
There are no trading revenues. The cost of all activities charged in the income statement relates to exploration and evaluation of mining properties. The group’s income statement and assets and liabilities are analysed as follows by geographical segments, which is the basis on which information is reported to the board.
Income statement analysis
| Unaudited six months ended 30 September 2025 | |||||
| UK | Sweden – investment | Canada – investment | Total | ||
| £ | £ | £ | £ | ||
| Expenses | (242,701) | 6,110 | – | (236,591) | |
| Investment income | 883 | – | – | 883 | |
| Finance costs | (92,235) | (6,722) | – | (98,957) | |
| Exchange rate movements | – | (34) | – | (34) | |
| Loss for the period | (334,053) | (646) | – | (334,699) | |
| Unaudited six months ended 30 September 2024 | ||||
| UK | Sweden – investment | Canada – investment | Total | |
| £ | £ | £ | £ | |
| Expenses | (187,450) | (26,125) | – | (213,575) |
| Equity settled employee benefits | (4,230) | – | – | (4,230) |
| Investment income | 2,169 | – | – | 2,169 |
| Finance costs | (88,642) | (6,742) | – | (95,384) |
| Exchange rate movements | – | (32) | – | (32) |
| Loss for the period | (278,153) | (32,899) | – | (311,052) |
Assets and liabilities
| ` | Unaudited 30 September 2025 | |||
| UK | Sweden investment | Canada investment | Total | |
| £ | £ | £ | £ | |
| Non current assets | 17,377,871 | 633,170 | 143,949 | 18,154,990 |
| Current assets | 77,977 | 1,172 | – | 79,149 |
| Liabilities | (4,370,796) | (359,649) | – | (4,730,445) |
| Net assets | 13,085,052 | 274,693 | 143,949 | 13,503,694 |
| Audited 31 March 2025 | ||||
| UK | Sweden investment | Canada investment | Total | |
| £ | £ | £ | £ | |
| Non current assets | 17,326,046 | 633,170 | 593,511 | 18,552,727 |
| Current assets | 80,083 | 1,169 | – | 81,252 |
| Liabilities | (3,993,161) | (366,775) | – | (4,359,936) |
| Net assets | 13,412,968 | 267,564 | 593,511 | 14,274,043 |
8. Deferred tax
There is an unrecognised deferred tax asset of £1.6 million (31 March 2025 – £1.6m) which, in view of the group’s results, is not considered to be recoverable in the short term. There are also capital allowances, including mineral extraction allowances, of £14.5 million (unchanged from 31 March 2025) unclaimed and available. No deferred tax asset is recognised in the condensed financial statements.
9. Mineral property exploration and evaluation costs
Mineral property exploration and evaluation costs incurred by the group are carried in the unaudited condensed consolidated financial statements at cost, less an impairment provision if appropriate. The recovery of these costs is dependent upon the successful development and operation of the Parys Mountain project which is itself conditional on financing being available to fund such development. During the period activities were limited and no drilling took place.
10. Investments
| Labrador | Grangesberg | Total | |
| £ | £ | £ | |
| At 1 April 2024 | 771,564 | 633,170 | 1,404,734 |
| Net change during the period | (178,053) | – | (178,053) |
| At 31 March 2025 | 593,511 | 633,170 | 1,226,681 |
| Net change during the period | (449,562) | – | (449,562) |
| At Unaudited 30 September 2025 | 143,949 | 633,170 | 777,119 |
Labrador – Canada
The group has an investment in Labrador Iron Mines Holdings Limited, (LIM) a Canadian company which is carried at fair value through other comprehensive income. The group’s holding of 19,289,100 shares in LIM (12% of LIM’s total issued shares) is valued at the closing price traded on the OTC Markets in the United States. In the directors’ assessment this market is sufficiently active to give the best measure of fair value, which on 30 September 2025 was 1 US cent per share (2024 – 8 US cents). As at 19 December 2025 the share price was 2 US cents per share.
Grängesberg – Sweden
The group has, through its Swedish subsidiary Angmag AB, a 49.8% ownership interest in Grängesberg Iron AB an unquoted Swedish company (GIAB) which holds rights over the Grängesberg iron ore deposits.
The directors assessed the fair value of the investment in Grängesberg under IFRS 9 and consider the investment’s value at 30 September 2025 to be £633,170.
11. Share capital
| Ordinary shares of 1p | Deferred shares of 4p | Total | ||||
| Issued and fully paid |
Nominal value £ |
Number | Nominal value £ |
Number | Nominal value £ |
|
| At 31 March 2024 | 4,200,931 | 420,093,017 | 5,510,833 | 137,770,835 | 9,711,764 | |
| Issued in the period | 647,292 | 64,729,238 | – | – | 647,292 | |
| At 31 March 2025 | 4,848,223 | 484,822,255 | 5,510,833 | 137,770,835 | 10,359,056 | |
| Issued in the period | – | – | – | – | – | |
| At Unaudited 30 September 2025 | 4,848,223 | 484,822,255 | 5,510,833 | 137,770,835 | 10,359,056 | |
The deferred shares are non-voting, have no entitlement to dividends and have negligible rights to return of capital on a winding up.
12. Financial instruments
| Group | Financial assets classified at fair value through other comprehensive income | Financial assets measured at amortised cost | ||
| Unaudited 30 September 2025 | 31 March 2025 | Unaudited 30 September 2025 | 31 March 2025 | |
| £ | £ | £ | £ | |
| Financial assets | ||||
| Investments | 777,119 | 1,048,628 | – | – |
| Deposit | – | – | 129,727 | 128,857 |
| Other receivables | – | – | 35,358 | 36,988 |
| Cash and cash equivalents | – | – | 43,791 | 44,264 |
| 777,119 | 1,048,628 | 208,876 | 210,109 | |
| Financial liabilities measured at amortised cost | ||||
| Unaudited 30 September 2025 | 31 March 2025 | |||
| £ | £ | |||
| Trade payables | (179,123) | (107,559) | ||
| Other payables | (270,111) | (156,275) | ||
| Loans | (4,231,211) | (4,046,102) | ||
| (4,680,445) | (4,309,936) | |||
Anglesey Mining plc
Directors
Andrew King Chairman
Rob Marsden Chief executive
Douglas Hall Non executive
Brendan Cahill Non executive
Jim Williams Non executive
Registered office address – Parys Mountain, Amlwch, Anglesey, LL68 9RE
Phone 01407 831275 Email mail@angleseymining.co.uk
Registrars MUFG Corporate Markets, 29 Wellington Street, Leeds, LS1 4DL
Share dealing phone 0371 664 0445 Helpline phone 0371 664 0300
Company registered number 01849957
Web site www.angleseymining.co.uk
Shares listed AIM – AYM
#AYM Anglesey Mining PLC – Signing of Letter of Intent to Progress High-Density Fluid Hydro-Power Energy Storage Project
 Anglesey Mining is pleased to announce that it has signed a Letter of Intent with RheEnergise Limited (“RheEnergise”) to further progress a high-density fluid hydro-power energy storage project at Parys Mountain.
Anglesey Mining is determined that the energy storage project be a force for good in the community and is delighted to have received in principle support for the scheme from the Amlwch Industrial Heritage Trust, Geo Môn and Menter Môn. Anglesey Mining is also grateful to the Anglesey Energy Island™ Programme, established by Isle of Anglesey County Council, for their practical advice and support.
The letter of intent sees the formation of a jointly owned special purpose vehicle (SPV) with the purpose of having the Parys Mountain site be the first commercial deployment of the High Density Hydro System. Anglesey Mining and RheEnergise have agreed to deploy resources into the SPV: financial, time, material, leases over land and IP and also to conduct a feasibility study over the project. If, as is expected, the study concludes that the project should go ahead, RheEnergise and Anglesey Mining will use their best endeavors to bring the Project to fruition.
Background
Anglesey Mining is focused on delivering a polymetallic underground mine at Parys Mountain. To that end, Anglesey Mining’s management is developing strategies to enable investment in the development of Parys Mountain to be incremental so far as practicable, thus allowing risks to be mitigated in stages before considering options for the next step of development.
A Pre-feasibility study (PFS) in the energy storage scheme is underway and part of that work has fed into a new illustrated presentation which provides potential investors with detailed information on the methodology and revenue streams associated with the proposed project in terms of both Long Duration Energy Storge (LDES) and how that might be the catalyst for the commencement of mining of the Parys Mountain VMS mineral deposits. The presentation can be viewed via this link: Parys HD Hydro Investor Presentation.pdf
It remains an essential and clear intent of this project that Anglesey Mining retains all the optionality that it currently has for the construction and commissioning of an underground mine. Also, that the hydro energy pumped storage project should not detract from those options over the medium and long term.
“ The signing of this Letter of Intent is an important next step in this project for both companies involved,” said Rob Marsden, Chief Executive of Anglesey Mining. “We are excited by the potential and synergies that this project brings together at many levels. Anglesey Mining is focused on delivering a polymetallic underground mine at Parys Mountain. Securing a source of consistent green power on Anglesey and establishing a presence back underground at Parys Mountain is key to the strategy of de-risking the incremental development of the mine and furtherance of the UK’s green power ambitions.”
Parys Mountain is the UK’s most advanced project for the primary mining of copper, lead, silver and zinc, which is on the Government’s critical minerals list.
For further information on the project:
RheEnergise – www.rheenergise.com / LinkedIn @rheenergise
Stephen Crosher, Chief Executive: sc@rheenergise.com
Philippa Rogers, Communications Manager: 07971 269559 / pr@rheenergise.com
Anglesey Mining plc – www.angleseymining.co.uk
Rob Marsden, CEO: 07531 475111 / rob.marsden@angleseymining.co.uk
About Anglesey Mining plc:
Anglesey Mining is traded on the AIM market of the London Stock Exchange and currently has 484,822,255 ordinary shares in issue.
Anglesey Mining is developing the 100% owned Parys Mountain Cu-Zn-Pb-Ag-Au VMS deposit in North Wales, UK with a reported resource of 5.3 million tonnes at over 4.0% combined base metals in the Measured and Indicated categories and 10.8 million tonnes at over 2.5% combined base metals in the Inferred category.
Anglesey Mining also holds a 49.8% interest in the Grängesberg iron ore project in Sweden. Plus an 11.9% interest of Labrador Iron Mines Holdings Limited which, through its 52% owned subsidiaries, is engaged in the exploration and development of direct shipping iron ore deposits in Labrador and Quebec.
Contact details for further information about Anglesey Mining plc:
Anglesey Mining plc
Rob Marsden, Chief Executive Officer – Tel: +44 (0)7531 475111
Andrew King, Chairman – Tel: +44 (0)7825 963700
Davy
Nominated Adviser & Joint Corporate Broker
Brian Garrahy / Daragh O’Reilly – Tel: +353 1 679 6363
Zeus Capital Limited
Joint Corporate Broker
Katy Mitchell / Harry Ansell – Tel: +44 (0)161 831 1512
LEI: 213800X8BO8EK2B4HQ71
#SVML Sovereign Metals LTD – Half-year Report
 INTERIM FINANCIAL REPORT
FOR THE HALF YEAR ENDED
31 DECEMBER 2024
abn 71 120 833 427
ASX: SVM; aim:SVML; OTCQX: SVMlf
CORPORATE DIRECTORY
|
Directors Mr Frank Eagar Managing Director and CEO Mr Ian Middlemas Non-Executive Director Dr Julian Stephens Non-Executive Director Mr Mark Pearce Non-Executive Director Mr Nigel Jones Non-Executive Director
CFO and Company Secretary
London Office
Cape Town Office Ground Floor, Block C, Telephone: +27 21 065 1890
Operations Office Area 4 Lilongwe Malawi
Registered and Principal Office
Stock Exchange Listings Australian Securities Exchange
United Kingdom London Stock Exchange (AIM) AIM Code: SVML – Depository Interests
Quotations United States OTCQX Best Market OTCQX code: SVMLF |
Nominated Advisor & Broker SP Angel Corporate Finance LLP Prince Frederick House 35-39 Maddox Street London W1S 2PP, United Kingdom Brokers Stifel Nicolaus Europe Limited London EC2V 6ET United Kingdom T: +44 20 7710 7600
Berenberg, Gossler & Co, KG, London Branch
Share Register Computershare Investor Services Pty Ltd
United Kingdom Computershare Investor Services PLC
Solicitors Simmons & Simmons
Auditor
Bankers Malawi – Standard Bank |
|
|
|
|
|
||
|
CONTENTS |
|||
|
|
|||
|
Directors’ Report |
|||
|
Consolidated Statement of Profit or Loss and Other Comprehensive Income |
|||
|
Consolidated Statement of Financial Position |
|||
|
Consolidated Statement of Changes in Equity |
|||
|
Consolidated Statement of Cash Flows |
|||
|
Notes to the Financial Statements |
|||
|
Directors’ Declaration |
|||
|
Competent Person Statement |
|||
|
Auditor’s Independence Declaration |
|||
|
Independent Auditor’s Review Report |
|||
DIRECTORS’ REPORT
The Directors of Sovereign Metals Limited present their report on Sovereign Metals Limited (Sovereign or the Company or Parent) and the entities it controlled at the end of, or during, the half year ended 31 December 2024 (Consolidated Entity or Group).
REVIEW AND RESULTS OF OPERATIONS
KASIYA RUTILE-GRAPHITE PROJECT
Sovereign is focused on the development of its Kasiya rutile-graphite project (Kasiya or the Project) in Malawi. The recently completed Optimised Pre-Feasibility Study (OPFS) confirmed Kasiya as a potentially major critical minerals project delivering industry-leading economic returns and sustainability metrics.
The Company’s objective is to develop a large-scale, long life rutile-graphite operation, focusing on developing an environmentally and socially responsible, sustainable operation.

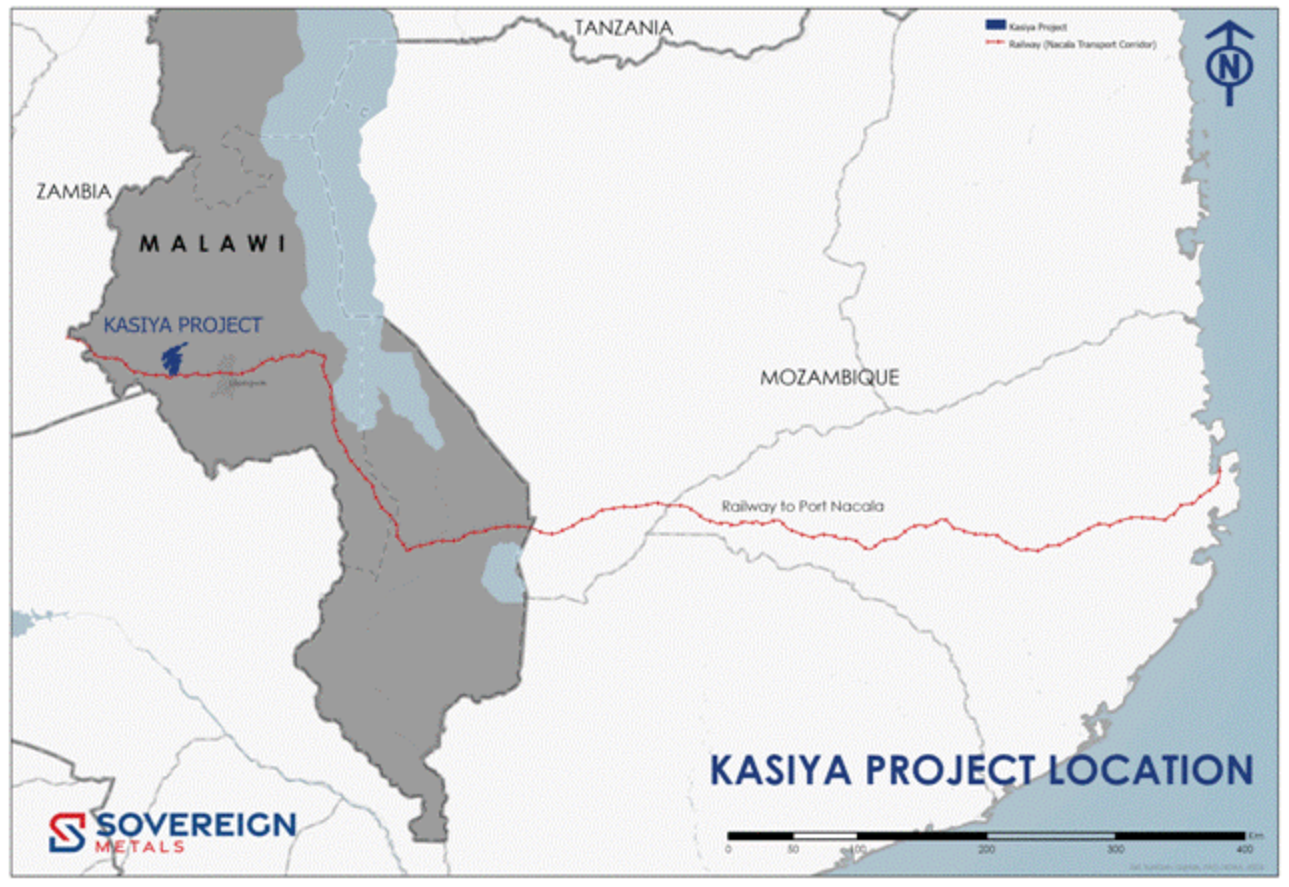
Figure 1: Kasiya Regional Project Location
HIGHLIGHTS DURING AND SUBSEQUENT TO PERIOD END
Optimised PFS Results Reaffirm Kasiya’s Globally Strategic Significance
· In January 2025, the OPFS was completed with oversight from Sovereign-Rio Tinto Technical Committee
· Results of the OPFS reaffirm Kasiya’s potential to become the largest and lowest-cost producer of natural rutile and natural flake graphite while generating exceptional economics
· Various optimisations have led to superior project delivery, operational flexibility, environmental and social outcomes compared to the 2023 Prefeasibility Study (PFS)
Pilot Phase Advanced to Rehabilitation Stage following Mining Trials and Backfilling
· In December 2024, material mined and stockpiled during the Pilot Mining and Land Rehabilitation (Pilot Phase) was placed back in the test pit, filling it to its original ground level
· On-site soil remediation and land rehabilitation activities are underway, testing Sovereign’s proposed rehabilitation approach and demonstrating how mined land can support sustainable farming post-closure
Rio Tinto Invests Additional A$19m Increasing Shareholding to 19.9%
· In July 2024, Rio Tinto invested a further A$18.5 million via the exercise of options to increase its shareholding in Sovereign. To date Rio Tinto has invested A$60 million for 19.9% of Sovereign
Positive Test Results for Use of Kasiya Graphite
· Very high quality Coated Spherical Purified Graphite (CSPG) anode material produced from Kasiya graphite concentrate with performance characteristics comparable to highest quality natural graphite battery material produced by dominant Chinese anode manufacturers
· In November 2024, Sovereign announced that preliminary tests confirmed that graphite concentrate produced from Kasiya exhibits prerequisite characteristics for selling graphite to the refractory materials sector
· In February 2025, further test work confirmed Kasiya’s graphite also has the key characteristics required for use in expandable (fire retardant) and expanded (gaskets, seals, and brake lining) applications
Infill Drilling Program Complete
· In October 2024, Sovereign announced the completion of an infill drilling program designed to upgrade Kasiya’s Mineral Resource Estimate (MRE) and to facilitate conversion of Ore Reserves from Probable to Proven category, with the upgrade due in the coming months
Next Steps
· Sovereign will continue to advance the Definitive Feasibility Study (DFS), provide updates on the rehabilitation component of the Pilot Phase, publish an upgrade to the MRE, continue with further graphite testwork to support potential offtake discussions and further its community and social development programs in Malawi


Figure 2: Pilot Phase test pit during mining trials (left) and subsequently backfilled and rehabilitated (right)
Optimised PFS Results Reaffirm Kasiya’s Globally Strategic Significance
Subsequent to the half year, the Company announced the results of an OPFS for Kasiya which was undertaken following a strategic investment by Rio Tinto Mining and Exploration Limited (Rio Tinto) in 2023. Under the Investment Agreement, a joint Technical Committee was established to oversee the development of Kasiya; the OPFS was conducted with oversight from the Sovereign-Rio Tinto Technical Committee.
Following input from various organisations, including internationally recognised, independent consultancies, the Company’s owner’s team, and subject matter experts from Rio Tinto, the OPFS has reconfirmed Kasiya as a leading global future supplier of strategic critical minerals outside of China.
The OPFS proposes a large-scale, long-life operation to deliver substantial volumes of natural rutile and graphite while generating significant returns. Table 1 below summarises the key findings from the OPFS and includes a comparison to the PFS results released 16 months ago, in September 2023. It is important to note that the results for the 2023 PFS in Table 1 have not been updated or adjusted for inflation since their release.
|
TABLE 1: KEY OPFS METRICS |
|
|
|
|
|
Units |
OPFS Results Jan 25 |
2023 PFS Sep 23 |
|
Production |
|
|
|
|
Initial Mine Life |
Years |
25 |
25 |
|
Plant Throughput (Stage 1: Years 1-4) |
Mtpa |
12 |
12 |
|
Plant Throughput (Stage 2: Years 5-25) |
Mtpa |
24 |
24 |
|
Average Annual Rutile Produced (95%+TiO2) |
ktpa |
222 |
222 |
|
Annual Average Graphite Produced (96% TGC)* |
ktpa |
233 |
244 |
|
Operating and Capital Expenditure |
|
|
|
|
Capex to First Production (Stage 1) |
US$M |
665 |
597 |
|
Total LOM Development Capex |
US$M |
1,127 |
1,250 |
|
Total LOM Sustaining Capex |
US$M |
397 |
470 |
|
Operating Costs (FOB Nacala) |
US$/t product |
423 |
404 |
|
Financial Performance |
|
|
|
|
Total Revenue* |
US$M |
16,367 |
16,121 |
|
Annual Revenue (Average LOM) |
US$M |
640 |
645 |
|
Annual EBITDA (Average LOM) |
US$M |
409 |
415 |
|
NPV8 (real, pre-tax) |
US$M |
2,322 |
2,419 |
|
IRR (pre-tax) |
% |
27% |
32% |
|
Revenue to Cost Ratio |
x |
2.8 |
2.8 |
*Annual average graphite produced includes 292kt of graphite processed and sold in two years post cessation of active ore mining. Average graphite produced during the 25-year initial mine life only is 240ktpa; total revenue during the same period is US$15,990 million. All rutile is produced and sold during the 25-year initial mine life. Note: All cashflows and costs are presented in US$ real January 2025 terms unless otherwise stated. Operating costs exclude mineral royalties and community development support costs.
Summary of Optimisations
The OPFS optimises seven key areas compared to the 2023 PFS, as summarised below.
Mining Method
The PFS proposed a 25-year initial LOM based on a hydraulic mining process where slurry material would be screened and pumped overland to the processing plants.
Based on findings from the mining trials undertaken as part of the Pilot Phase, the OPFS proposes a large-scale open-pit dry mining operation using draglines and trucking of material to the processing plants. The change in mining method has not changed the initial mine life of 25 years.
Operating Model
The 2023 PFS envisaged mining would take place on a contractor basis.
During the OPFS, Sovereign undertook a trade-off analysis between the following operating options:
· Fully owner-operated mine with draglines and trucks purchased by the owner
· Owner-operated mine with draglines and trucks leased by the owner
· Mining contractor operation using excavators and trucks
Due to the preference for draglines and benefit of flexibility, an owner-operated mine with leased equipment is selected as the preferred operating model.
Plant Configuration
Dry mining Kasiya means the material received at the plant is not pre-wet and pre-scrubbed. Therefore, the OPFS proposes a process plant front end consisting of two scrubbers and two oversize screens per 12Mt plant. No further changes are proposed to the processing plant flowsheet.
Plant Location
Per the 2023 PFS, mining would commence in the southern area of the Kasiya deposit, ramping up to 12Mt per annum (Mtpa) and then scaling up to 24Mtpa in Year 5 by constructing a second plant module in the same area, reaching nameplate capacity by the end of that year.
In Year 10 of production, another new 12Mtpa plant module would be built and commissioned in the northern area of Kasiya, supported by the relocation to the north of one of the southern plants to maintain a steady state of 24Mtpa.
However, the OPFS has determined the most efficient plant locations to be an initial 12Mtpa South Kasiya plant followed by the construction of another 12Mtpa North Kasiya plant in year 5 of production, negating any relocation requirements in later years.
The OPFS maintains the ROM schedule with operations commencing with 12Mtpa of throughput during the first four years of production (Stage 1) and expanding to 24Mtpa in year 5, with full capacity reached by end of year 5 (Stage 2).
Tailings Management
Per the PFS, a conventional process would be used to produce rutile and graphite concentrate with tailings in separate sand and fines streams being pumped to a conventional TSF. Mined out pit areas would be backfilled as part of a rehabilitation process.
The OPFS proposes maximising backfilling of pits as undertaken during the Pilot Phase and the introduction of mud farming on the TSF to accelerate dewatering. This approach has reduced tailings volumes in the TSF by 44% from 187 Mm³ to 105 Mm³.
Mud farming is a technique used by Rio Tinto at operations such as its 100%-owned Weipa bauxite operations in Queensland, Australia, which has been in production since 1963 and produced 35.1Mt of bauxite in 2023.
Water Management
The PFS proposed that the primary water supply for the Kasiya mining complex would be created by building a water storage dam and collecting run-off water from the greater catchment area. Following the introduction of dry mining and mud farming, the size of the water storage dam proposed in the PFS has been significantly reduced, with less process water required and more process water recovered.
The OPFS mining trials and material deposition tests indicated a water demand of 10.2 Mm³ per annum, almost a 40% decrease in water requirement from the PFS (16.7 Mm³). The effect on the water storage dam wall could be a reduction in volume from 0.79 Mm³ to 0.57 Mm³ and a reduction in dam wall height from 20 metres to 17 metres.
Power
The 2023 PFS envisaged a hybrid hydro-generated grid power plus solar power system solution.
The Malawi grid reliability has improved since completion of the PFS and is expected to further improve considerably with the commissioning of the country’s first HV transmission interconnector to Mozambique in Q2 2025.
This will provide the Project with sufficient power and therefore the OPFS proposes to connect the Project’s power system to the hydro-sourced grid network only. This mitigates any risks associated with commissioning a new solar power project and reducing the overall power tariff by eliminating the need for an Independent Power Producer as per the 2023 PFS.
Pilot Phase Advanced to Rehabilitation Stage Following Mining Trials and Backfilling
In December 2024, the Company announced that the test pit mined during the Pilot Phase at the Kasiya Project had been successfully backfilled. This allowed Sovereign to commence on-site soil remediation and land rehabilitation activities, testing our proposed rehabilitation approach and demonstrating that the mined land can support sustainable farming post-closure.
During the Pilot Phase mining trials, 170,000m3 was mined using a conventional excavator fleet. The fleet was used to place mined material back into the pit, filling the pit to the original ground level in less than two months and ahead of schedule.
In March 2025, the Company announced the success of the rehabilitation program with landowners given immediate access to land to start maize crop farming without missing a planting season.
Positive Test Results for Use of Kasiya Graphite in Refractory and Expandable Markets
The Company has announced that downstream testwork targeting the traditional graphite market, conducted at leading independent consultancies ProGraphite GmbH (ProGraphite) and Dorfner Anzaplan (DorfnerA) in Germany, have delivered very positive test results, which will be used for customer engagement and potential offtake discussions.
Preliminary tests confirmed that graphite concentrate produced from Kasiya in Malawi exhibits prerequisite characteristics required for graphite sales into the refractory materials sector and for use in expandable (fire retardant) and expanded (gaskets, seals, and brake lining) applications.
Traditional demand for natural graphite is primarily tied to the steel industry where it is used as a component in bricks that line both blast and electric arc furnaces (“refractories”) and as a liner for ladles and crucibles. It is used in brake linings, gaskets and clutch materials in the automotive industry. Graphite has many other industrial uses in lubricants, carbon brushes for electric motors, fire retardants, and insulation and reinforcement products.
Graphite’s key properties for use in refractory applications are its resistance to oxidation, chemical inertness and good thermal conductivity.
A key use for expandable graphite is as a flame retardant. Growth for expandable graphite flame retardants, is driven by concerns over halogen-based flame retardants, which include brominated and chlorinated flame retardants. Many of these chemicals are now recognised as global contaminants and are associated with adverse health effects in animals and humans, including endocrine and thyroid disruption, immunotoxicity, reproductive toxicity, and cancer (National Institute of Health).
Expanded graphite is used in gaskets, seals, brake linings, bi-polar plates for fuel cells, and thermal management in electronic devices, where the inherent properties of graphite are combined with the flexibility of expanded graphite.

Figure 3: Natural graphite market per application (Benchmark Minerals Intelligence, 2025)
Infill Drilling Program Complete
In October 2024, the Company announced the completion of an infill drilling program at Kasiya to support an upgrade of the MRE.
Aircore drilling, supported by hand auger, push tube and diamond core drilling, was completed in the southern part of Kasiya. The drilling was focused on the designated pits proposed to provide ore feed in the first eight years of the Project’s production schedule. Ore Reserves in these areas are expected to convert from the Probable to Proven category with an upgrade of the current MRE from Indicated to the Measured category under the JORC (2012) Code.
Offsite laboratories in South Africa and Australia will assay all samples for rutile and graphite. The drilling program’s results and subsequent Resource upgrade are expected in early 2025.
Kasiya is already the world’s largest rutile deposit and second-largest flake graphite deposit, with over 66% of the current MRE in the Indicated category.
Corporate Update
Sovereign remains in a strong financial position with cash at bank of approximately A$34 million and no debt.
Next Steps
The Company plans to update the market on the following progress in the coming months:
· Planned MRE upgrade
· Further graphite test work results as the Company continues to advance the qualification of its graphite product for the lithium-ion battery and traditional graphite sectors
· Progress in discussions with future potential end-users of rutile and graphite
· Updates on community and social development programs
· Further rehabilitation aspects of the Pilot Phase
· Progress of the DFS, which is targeted for completion in Q4, 2025
DIRECTORS
The names of Directors in office at any time during the financial period or since the end of the financial period are:
Mr Benjamin Stoikovich Chairman
Mr Frank Eagar Managing Director and CEO
Mr Ian Middlemas Non-Executive Director
Dr Julian Stephens Non-Executive Director
Mr Mark Pearce Non-Executive Director
Mr Nigel Jones Non-Executive Director
All Directors were in office from 1 July 2024 until the date of this report, unless otherwise noted.
OPERATING RESULTS
The net operating loss after tax for the half year ended 31 December 2024 was $19,546,116 (2023: $6,976,503) which is attributable to:
(i) Interest income of $1,025,751 (2023: $938,402) earned on cash term deposits held by the Group;
(ii) exploration and evaluation expenditure of $16,495,513 (2023: $5,027,397) in relation to the Kasiya Project. This is attributable to the Group’s accounting policy of expensing exploration and evaluation expenditure incurred by the Group subsequent to acquisition of the rights to explore and up to the completion of feasibility studies; and
(iii) non-cash share based payment expenses of $1,904,852 (2023: $1,089,974) relating to performance rights. The fair value of incentive options and rights is measured at grant date and recognised over the period during which the performance rights holders become unconditionally entitled to the incentive securities.
FINANCIAL POSITION
At 31 December 2024, the Company had cash and cash equivalents of $33,531,689 (30 June 2024: $31,564,130) and no debt (30 June 2024: nil). The Company had net assets of $35,927,994 (30 June 2024: $34,358,774), an increase of $1,569,220 or approximately 4% compared with the prior period. This is largely attributable to the increase in cash reserves following the investment made by Rio Tinto in the period offset by exploration and evaluation spend on the project to complete the Pilot Phase and OPFS.
SIGNIFICANT POST BALANCE DATE EVENTS
On 22 January 2025, the Company announced the results of an OPFS for Kasiya which reaffirm Kasiya’s potential to become the largest and lowest-cost producer of natural rutile and natural flake graphite while generating exceptional economics.
Other than the above, there are no matters or circumstances which have arisen since 31 December 2024 that have significantly affected or may significantly affect:
· the operations, in periods subsequent to 31 December 2024, of the Group;
· the results of those operations, in periods subsequent to 31 December 2024, of the Group; or
· the state of affairs, in periods subsequent to 31 December 2024, of the Group.
AUDITOR’S INDEPENDENCE DECLARATION
Section 307C of the Corporations Act 2001 requires our auditors, Ernst & Young, to provide the directors of Sovereign Metals Limited with an Independence Declaration in relation to the review of the half year financial report. This Independence Declaration is on page 17 and forms part of this Directors’ Report.
This report is made in accordance with a resolution of the directors made pursuant to section 306(3) of the Corporations Act 2001.
For and on behalf of the Directors
Frank Eagar
Managing Director and CEO
7 March 2025
CONSOLIDATED STATEMENT OF PROFIT OR LOSS AND OTHER COMPREHENSIVE INCOME
FOR THE HALF YEAR ENDED 31 DECEMBER 2024
|
Notes |
Half Year Ended |
Half Year Ended |
|
|
Interest income |
1,025,751 |
938,402 |
|
|
Exploration and evaluation expenses |
(16,495,513) |
(5,027,397) |
|
|
Corporate and administrative expenses |
(779,930) |
(572,119) |
|
|
Business development expenses |
(1,004,695) |
(996,548) |
|
|
Share based payment expense |
9(a) |
(1,904,852) |
(1,089,974) |
|
Other expenses |
3 |
(386,877) |
(173,386) |
|
Demerger expenses |
– |
(55,481) |
|
|
Loss before income tax |
|
(19,546,116) |
(6,976,503) |
|
Income tax expense |
– |
– |
|
|
Loss for the period |
|
(19,546,116) |
(6,976,503) |
|
|
|||
|
Other comprehensive income, net of income tax: |
|||
|
Items that may be reclassified subsequently to profit or loss |
|||
|
Exchange differences on foreign entities |
80,624 |
3,530 |
|
|
Other comprehensive income for the period, net of income tax |
80,624 |
3,530 |
|
|
Total comprehensive loss for the period |
|
(19,465,492) |
(6,972,973) |
|
Loss attributable to members of Sovereign Metals Limited |
|
(19,465,492) |
(6,972,973) |
|
|
|||
|
Total comprehensive loss attributable to members of Sovereign Metals Limited |
|
(19,465,492) |
(6,972,973) |
|
|
|||
|
Basic and diluted loss per share from continuing operations (cents per share) |
(3.3) |
(1.1) |
The above Consolidated Statement of Profit or Loss and Other Comprehensive Income should be read in conjunction with the accompanying notes.
CONSOLIDATED STATEMENT OF FINANCIAL POSITION
AS AT 31 DECEMBER 2024
|
Notes |
31 December 2024 |
30 June 2024 |
|
|
ASSETS |
|||
|
Current Assets |
|||
|
Cash and cash equivalents |
33,531,689 |
31,564,130 |
|
|
Other receivables |
4 |
506,258 |
315,597 |
|
Other financial assets |
|
175,000 |
560,000 |
|
Total Current Assets |
|
34,212,947 |
32,439,727 |
|
|
|
|
|
|
Non-current Assets |
|
|
|
|
Property, plant and equipment |
5 |
2,009,700 |
1,149,771 |
|
Exploration and evaluation assets |
6 |
5,086,129 |
5,086,129 |
|
Total Non-current Assets |
|
7,095,829 |
6,235,900 |
|
|
|
|
|
|
TOTAL ASSETS |
|
41,308,776 |
38,675,627 |
|
|
|
||
|
LIABILITIES |
|
|
|
|
Current Liabilities |
|
|
|
|
Trade and other payables |
|
5,184,642 |
4,138,353 |
|
Provisions |
|
86,849 |
56,782 |
|
Other financial liabilities |
7(a) |
41,378 |
35,288 |
|
Total Current Liabilities |
|
5,312,869 |
4,230,423 |
|
|
|
|
|
|
Non-Current Liabilities |
|
|
|
|
Other financial liabilities |
7(b) |
67,913 |
86,430 |
|
Total Non-Current Liabilities |
|
67,913 |
86,430 |
|
|
|
|
|
|
TOTAL LIABILITIES |
|
5,380,782 |
4,316,853 |
|
NET ASSETS |
|
35,927,994 |
34,358,774 |
|
|
|
||
|
EQUITY |
|
|
|
|
Issued capital |
8 |
136,965,491 |
117,835,631 |
|
Reserves |
9 |
(1,374,794) |
(3,360,270) |
|
Accumulated losses |
(99,662,703) |
(80,116,587) |
|
|
TOTAL EQUITY |
35,927,994 |
34,358,774 |
The above Consolidated Statement of Financial Position should be read in conjunction with the accompanying notes.
CONSOLIDATED STATEMENT OF CHANGES IN EQUITY
FOR THE HALF YEAR ENDED 31 DECEMBER 2024
|
Issued Capital |
Share Based Payment Reserve |
Demerger Reserve $ |
Foreign Currency Translation Reserve $ |
Accumulated Losses |
Total Equity |
|
|
Balance at 1 July 2024 |
117,835,631 |
3,605,751 |
(7,336,678) |
370,657 |
(80,116,587) |
34,358,774 |
|
Net loss for the period |
– |
– |
– |
– |
(19,546,116) |
(19,546,116) |
|
Other comprehensive income |
– |
– |
– |
80,624 |
– |
80,624 |
|
Total comprehensive income/(loss) for the period |
– |
– |
– |
80,624 |
(19,546,116) |
(19,465,492) |
|
Transactions with owners, recorded directly in equity |
|
|
|
|
|
|
|
Issue of placement shares |
19,174,395 |
– |
– |
– |
– |
19,174,395 |
|
Cancelation of unvested performance rights |
– |
(22,754) |
– |
– |
– |
(22,754) |
|
Share based payment expense |
– |
1,927,606 |
– |
– |
– |
1,927,606 |
|
Share issue costs |
(44,535) |
– |
– |
– |
– |
(44,535) |
|
Balance at 31 December 2024 |
136,965,491 |
5,510,603 |
(7,336,678) |
451,281 |
(99,662,703) |
35,927,994 |
|
Balance at 1 July 2023 |
74,508,488 |
4,155,950 |
(7,336,678) |
(139,498) |
(61,515,693) |
9,672,569 |
|
Net loss for the period |
– |
– |
– |
– |
(6,976,503) |
(6,976,503) |
|
Other comprehensive income |
– |
– |
– |
3,530 |
– |
3,530 |
|
Total comprehensive income/(loss) for the period |
– |
– |
– |
3,530 |
(6,976,503) |
(6,972,973) |
|
Transactions with owners, recorded directly in equity |
||||||
|
Issue of placement shares |
40,598,258 |
– |
– |
– |
– |
40,598,258 |
|
Transfer from SBP reserve upon conversion of performance rights |
2,853,400 |
(2,853,400) |
– |
– |
– |
– |
|
Share based payment expense |
– |
1,089,974 |
– |
– |
– |
1,089,974 |
|
Share issue costs |
(124,515) |
– |
– |
– |
– |
(124,515) |
|
Balance at 31 December 2023 |
117,835,631 |
2,392,524 |
(7,336,678) |
(135,968) |
(68,492,196) |
44,263,313 |
The above Consolidated Statement of Changes in Equity should be read in conjunction with the accompanying notes.
CONSOLIDATED STATEMENT OF CASH FLOWS
FOR THE HALF YEAR ENDED 31 DECEMBER 2024
|
Half Year Ended |
Half Year Ended |
|
|
Cash flows from operating activities |
||
|
Payments to suppliers and employees – exploration and evaluation |
(15,479,030) |
(5,433,663) |
|
Payments to suppliers and employees – other |
(1,764,767) |
(1,616,960) |
|
Interest received |
1,031,209 |
744,942 |
|
Net cash used in operating activities |
(16,212,588) |
(6,305,681) |
|
|
||
|
Cash flows from investing activities |
|
|
|
Payments for purchase of plant and equipment |
(916,061) |
(205,902) |
|
Repayment of loan receivable from NGX Limited |
– |
34,434 |
|
Net cash used in investing activities |
(916,061) |
(171,468) |
|
|
||
|
Cash flows from financing activities |
|
|
|
Proceeds from issue of shares |
19,174,395 |
40,598,258 |
|
Payments for share issue costs |
(44,535) |
(248,778) |
|
Payments for finance lease |
(31,777) |
– |
|
Net cash from financing activities |
19,098,083 |
40,349,480 |
|
|
||
|
Net increase in cash and cash equivalents |
1,969,434 |
33,872,331 |
|
Net foreign exchange differences |
(1,875) |
– |
|
Cash and cash equivalents at the beginning of the period |
31,564,130 |
5,564,376 |
|
Cash and cash equivalents at the end of the period |
33,531,689 |
39,436,707 |
The above Consolidated Statement of Cash Flows should be read in conjunction with the accompanying notes.
NOTES TO THE FINANCIAL STATEMENTS
FOR THE HALF YEAR ENDED 31 DECEMBER 2024
1. MATERIAL ACCOUNTING POLICY INFORMATION
Sovereign Metals Limited (the “Company”) is a for profit company limited by shares and incorporated in Australia, whose shares are publicly traded on the Australian Securities Exchange, the AIM Market of the London Stock Exchange and a Quotation on OTCQX in the U.S. The consolidated interim financial statements of the Company as at and for the period from 1 July 2024 to 31 December 2024 comprise the Company and its subsidiaries (together referred to as the “Group”). The nature of the operations and principal activities of the Group are as described in the Directors’ Report.
This interim financial report does not include all the notes of the type normally included in an annual financial report. Accordingly, this report is to be read in conjunction with the audited annual report of Sovereign for the year ended 30 June 2024 (where comparative amounts have been extracted from) and any public announcements made by the Group during the interim reporting period in accordance with the continuous disclosure requirements of the Corporations Act 2001.
(a) Basis of Preparation of Half Year Financial Report
The consolidated financial statements have been prepared on the basis of historical cost, except for the revaluation of certain financial instruments. Cost is based on the fair values of the consideration given in exchange for assets. All amounts are presented in Australian dollars, unless otherwise stated. There have been no changes in the critical accounting judgements or key sources of estimation since 30 June 2024.
(b) Statement of Compliance
The consolidated interim financial report complies with Australian Accounting Standards, including AASB 134 which ensures compliance with International Financial Reporting Standard (“IFRS”) IAS 34 “Interim Financial Reporting” as issued by the International Accounting Standards Board. The accounting policies adopted in the preparation of the half-year financial report are consistent with those applied in the preparation of the Group’s annual financial report for the year ended 30 June 2024, except for new standards, amendments to standards and interpretations effective 1 July 2024. In the current half year, the Group has adopted all of the new and revised Standards and Interpretations issued by the AASB that are relevant to its operations and effective for the current annual reporting period. The adoption resulted in no material impact.
(c) Issued standards and interpretations not early adopted
Australian Accounting Standards and Interpretations that have recently been issued or amended but are not yet effective have not been adopted by the Group for the reporting period ended 31 December 2024. Those which may be relevant to the Group are set out in the table below. The impact of these standards are still being assessed.
|
Standard/Interpretation |
Application Date of Standard |
Application Date for Group |
|
AASB 2014-10 Amendments to Australian Accounting Standards – Sale or Contribution of Assets between an Investor and its Associate or Joint Venture |
1 January 2025 |
1 July 2025 |
|
AASB 18 Presentation and Disclosure in Financial Statements |
1 January 2027 |
1 July 2027 |
2. SEGMENT INFORMATION
AASB 8 requires operating segments to be identified on the basis of internal reports about components of the Consolidated Entity that are regularly reviewed by the chief operating decision maker in order to allocate resources to the segment and to assess its performance. The Consolidated Entity has one operating segment, being exploration in Malawi.
3. OTHER EXPENSES
|
31 December 2024 |
31 December 2023 |
|
|
Foreign exchange (loss)/gain |
(1,877) |
1,614 |
|
Fair value movements in other financial assets |
(385,000) |
(175,000) |
|
|
(386,877) |
(173,386) |
4. CURRENT ASSETS – OTHER RECEIVABLES
|
31 December 2024 |
30 June 2024 |
|
|
Accrued interest |
140,454 |
145,913 |
|
GST receivable |
95,664 |
81,051 |
|
Prepayments |
203,559 |
52,655 |
|
Other |
66,581 |
35,978 |
|
|
506,258 |
315,597 |
5. NON-CURRENT ASSETS – PROPERTY, PLANT AND EQUIPMENT
|
Office Furniture and Equipment $ |
Computer Equipment $ |
Plant & Equipment $ |
Right of use $ |
Assets under construction $ |
Total $ |
|
|
Carrying amount at |
152,163 |
68,566 |
496,953 |
116,447 |
315,642 |
1,149,771 |
|
Additions |
31,758 |
30,516 |
768,298 |
– |
73,062 |
903,634 |
|
Depreciation charge |
(15,546) |
(17,761) |
(64,801) |
(21,663) |
– |
(119,771) |
|
Foreign exchange differences |
10,217 |
3,557 |
33,604 |
4,257 |
24,431 |
76,066 |
|
Carrying amount at |
178,592 |
84,878 |
1,234,054 |
99,041 |
413,135 |
2,009,700 |
|
At cost |
227,879 |
153,292 |
1,803,664 |
134,091 |
388,704 |
2,707,630 |
|
Accumulated depreciation, amortisation and impairment |
(49,287) |
(68,414) |
(569,610) |
(35,050) |
24,431 |
(697,930) |
6. EXPLORATION AND EVALUATION ASSETS
|
31 December 2024 |
|
(a) Movement in Exploration and Evaluation Assets |
|
Kasiya Rutile-Graphite Project: |
|
|
Carrying amount as at 1 July 2024 |
5,086,129 |
|
Carrying amount at 31 December 2024(i) |
5,086,129 |
Note:
(i) The ultimate recoupment of costs carried forward for exploration and evaluation is dependent on the successful development and commercial exploitation or sale of the respective areas of interest.
7. OTHER FINANCIAL LIABILITIES
|
31 December 2024 |
30 June 2024 |
|
(a) Current liabilities |
||
|
Lease Liability(i) |
41,378 |
35,288 |
(b) Non-Current liabilities |
|
|
|
Lease Liability(i) |
67,913 |
86,430 |
Note:
(i) The Company has a lease agreement for the rental of a property. Refer to Note 5 for the carrying amount of the right of use asset relating to the lease. The following are amounts recognised in the Statement of Profit and Loss: (i) amortisation expense of right of use asset $21,663 (30 June 2024: $17,454); (ii) interest expense on lease liabilities of $14,311 (30 June 2024: $12,961); and (iii) rent expense of $5,660 (30 June 2024: $7,922).
8. CONTRIBUTED EQUITY
|
31 December 2024 |
30 June 2024 |
|
(a) Issued and Paid Up Capital |
||
|
599,879,879 (30 June 2024: 563,003,401) fully paid ordinary shares (Note 8(b)) |
136,965,491 |
117,835,631 |
(b) Movements in Ordinary Share Capital were as follows:
|
Date |
Details |
Number of Shares |
|
|
1 Jul 24 |
Opening balance |
563,003,401 |
117,835,631 |
|
4 Jul 24 |
Issue of ordinary shares on exercise of Rio Tinto Options |
34,549,598 |
18,484,035 |
|
13 Sep 24 |
Issue of ordinary shares to Rio Tinto |
1,290,392 |
690,360 |
|
13 Sep 24 |
Issue of advisory fee shares |
1,036,488 |
– |
|
31 Dec 24 |
Share issue costs |
– |
(44,535) |
|
31 Dec 24 |
Closing balance |
599,879,879 |
136,965,491 |
9. RESERVES
|
31 December 2024 |
30 June 2024 |
|
|
Share-based Payments Reserve (Note 9(a)) |
5,510,603 |
3,605,751 |
|
Foreign Currency Translation Reserve – exchange differences |
451,281 |
370,657 |
|
Demerger Reserve |
(7,336,678) |
(7,336,678) |
|
|
(1,374,794) |
(3,360,270) |
(a) Movements in Options and Performance Rights were as follows:
|
Date |
Details |
Number of Unlisted Performance Rights |
|
|
1 Jul 2024 |
Opening balance |
17,860,000 |
3,605,751 |
|
Various |
Issue of performance rights |
4,725,000 |
– |
|
31 Dec 2024 |
Cancelation of unvested performance rights |
(425,000) |
(22,754) |
|
31 Dec 2024 |
Share based payment expense |
– |
1,927,606 |
|
31 Dec 2024 |
Closing balance |
22,160,000 |
5,510,603 |
Note
(i) The value of performance rights granted during the period is estimated as at the grant date based on the underlying share price with the expense recognised over the vesting period in accordance with Australian Accounting Standards.
10. COMMITMENTS AND CONTINGENCIES
(a) Commitments
|
|
31 December 2024 |
30 June 2024 |
|
Exploration Commitments – Kasiya Rutile-Graphite Project: |
||
|
Within one year |
201,477 |
107,155 |
|
After one year but not more than five years |
82,043 |
46,705 |
|
|
283,520 |
153,860 |
As a condition of retaining the current rights to tenure to exploration tenements, the Group is required to pay an annual rental charge and meet minimum expenditure requirements for each tenement. These obligations are not provided for in the financial statements and are at the sole discretion of the Group. The majority of the remaining exploration commitments relate to licences with a term greater than one year. For the purposes of disclosure, the Group has apportioned the remaining commitments on an equal monthly basis over the remaining term of the exploration licences.
(b) Contingencies
At the last annual reporting date, the Consolidated Entity did not have any material contingent liabilities. There has been no material change in contingent assets and liabilities of the Consolidated Entity during the half year.
11. DIVIDENDS PAID OR PROVIDED FOR
No dividend has been paid or provided for during the half year (2023: nil).
12. FAIR VALUE OF FINANCIAL INSTRUMENTS
The net fair value of financial assets and financial liabilities approximates their carrying value.
13. SUBSEQUENT EVENTS AFTER BALANCE DATE
On 22 January 2025, the Company announced the results of an OPFS for Kasiya which reaffirm Kasiya potential to become the largest and lowest-cost producer of natural rutile and natural flake graphite while generating exceptional economics.
Other than the above, there are no matters or circumstances which have arisen since 31 December 2024 that have significantly affected or may significantly affect:
· the operations, in periods subsequent to 31 December 2024, of the Group;
· the results of those operations, in periods subsequent to 31 December 2024, of the Group; or
· the state of affairs, in periods subsequent to 31 December 2024, of the Group.
DIRECTORS’ DECLARATION
In accordance with a resolution of the Directors of Sovereign Metals Limited, I state that:
In the opinion of the Directors:
(a) the financial statements and notes thereto are in accordance with the Corporations Act 2001, including:
(i) complying with Accounting Standard AASB 134: Interim Financial Reporting and the Corporations Regulations 2001; and
(ii) giving a true and fair view of the consolidated entity’s financial position as at 31 December 2024 and of its performance for the half year ended on that date.
(b) there are reasonable grounds to believe that the Company will be able to pay its debts as and when they become due and payable.
This declaration is signed in accordance with a resolution of the Board of Directors made pursuant to section 303(5) of the Corporations Act 2001.
On behalf of the Board
Frank Eagar
Managing Director and CEO
7 March 2025
Competent Person Statement
The information in this announcement that relates to Production Targets, Ore Reserves, Processing, Infrastructure and Capital and Operating Costs is extracted from an announcement dated 22 January 2025, which is available to view at www.sovereignmetals.com.au. Sovereign confirms that: a) it is not aware of any new information or data that materially affects the information included in the original announcement; b) all material assumptions and technical parameters underpinning the Production Target, and related forecast financial information derived from the Production Target included in the original announcement continue to apply and have not materially changed; and c) the form and context in which the relevant Competent Persons’ findings are presented in this presentation have not been materially modified from the original announcement.
The information in this announcement that relates to the Exploration Results (metallurgy – rutile and graphite) is extracted from announcements dated 8 May 2024, 15 May 2024, 4 September 2024, 21 November 2024, 19 February 2025 and 26 February 2025 which are available to view at www.sovereignmetals.com.au. Sovereign confirms that a) it is not aware of any new information or data that materially affects the information included in the original announcement; b) all material assumptions included in the original announcement continue to apply and have not materially changed; and c) the form and context in which the relevant Competent Persons’ findings are presented in this report have not been materially changed from the announcement.
The information in this announcement that relates to the Mineral Resource Estimate is extracted from Sovereign’s 2024 Annual Report and is based on, and fairly represents information compiled by Mr Richard Stockwell, a Competent Person, who is a fellow of the Australian Institute of Geoscientists (AIG). Mr Stockwell is a principal of Placer Consulting Pty Ltd, an independent consulting company. Sovereign confirms that a) it is not aware of any new information or data that materially affects the information included in the original announcement; b) all material assumptions included in the 2024 Annual Report continue to apply and have not materially changed; and c) the form and context in which the relevant Competent Persons’ findings are presented in 2024 Annual Report have not been materially changed from the disclosure in the 2024 Annual Report.
|
Ore Reserve for the Kasiya Deposit |
|
||||||
|
Classification |
Tonnes |
Rutile Grade |
Contained Rutile |
Graphite Grade (TGC) (%) |
Contained Graphite |
RutEq. Grade* |
|
|
Proved |
– |
– |
– |
– |
– |
– |
|
|
Probable |
538 |
1.03% |
5.5 |
1.66% |
8.9 |
2.00% |
|
|
Total |
538 |
1.03% |
5.5 |
1.66% |
8.9 |
2.00% |
|
* RutEq. Formula: Rutile Grade x Recovery (100%) x Rutile Price (US$1,484/t) + Graphite Grade x Recovery (67.5%) x Graphite Price (US$1,290/t) / Rutile Price (US$1,484/t). All assumptions are from the Kasiya PFS ** Any minor summation inconsistencies are due to rounding
|
Kasiya Total Indicated + Inferred Mineral Resource Estimate at 0.7% rutile cut-off grade (inclusive of Ore Reserves) |
|||||
|
Classification |
Resource |
Rutile Grade |
Contained Rutile |
Graphite Grade (TGC) (%) |
Contained Graphite |
|
Indicated |
1,200 |
1.0% |
12.2 |
1.5% |
18.0 |
|
Inferred |
609 |
0.9% |
5.7 |
1.1% |
6.5 |
|
Total |
1,809 |
1.0% |
17.9 |
1.4% |
24.4 |
Forward Looking Statement
This release may include forward-looking statements, which may be identified by words such as “expects”, “anticipates”, “believes”, “projects”, “plans”, and similar expressions. These forward-looking statements are based on Sovereign’s expectations and beliefs concerning future events. Forward looking statements are necessarily subject to risks, uncertainties and other factors, many of which are outside the control of Sovereign, which could cause actual results to differ materially from such statements. There can be no assurance that forward-looking statements will prove to be correct. Sovereign makes no undertaking to subsequently update or revise the forward-looking statements made in this release, to reflect the circumstances or events after the date of that release.
AUDITOR’S INDEPENDENCE DECLARATION

INDEPENDENT AUDITOR’S REVIEW REPORT


#SVML Sovereign Metals LTD – Lithium-Ion Battery Graphite Program Upscaled
KASIYA LITHIUM-ION BATTERY GRAPHITE PROGRAM SIGNIFICANTLY UPSCALED
· Bulk sampling program underway at Kasiya to extract 100 tonnes of ore to produce over 1,000kg of natural graphite for lithium-ion battery anode testwork and product qualification
· The upscaled graphite qualification program will support upcoming project studies with our strategic partner, Rio Tinto
· Sovereign and Rio Tinto have agreed to collaborate to qualify graphite from Kasiya, with a particular focus on supplying the spherical purified graphite (SPG) segment of the lithium-ion battery anode market
· Previous testwork confirmed Kasiya’s graphite to have near perfect crystallinity and high purity – both key attributes for suitability in lithium-ion battery feedstock
· Kasiya’s recent Pre-Feasibility Study (PFS) confirmed it could be one of the world’s largest natural graphite producers at 244kt per annum with the lowest cash operating costs globally at US$404/t and the lowest CO2-footprint
· As one of the largest known natural graphite deposits globally, close to existing infrastructure connecting it to global markets, Kasiya is set to become a strategic source of long term, secure supply outside of China
· This graphite qualification program coincides with news of China’s curbs on exports of natural graphite, a critical mineral for the US, EU, Japan and Australia
Sovereign Metals Limited (ASX:SVM; AIM:SVML) (the Company or Sovereign) is pleased to announce that a bulk sampling program to extract over 100 tonnes of ore from Kasiya is underway. The bulk sampling program is part of the Company’s graphite bulk sample program for qualification, downstream testwork and product development. A major component to graphite sales agreements is customer qualification with graphite produced from this program to be shared with prospective end-users in addition to being used for upscaled downstream test-work.
The Company’s upscaled graphite program comes as China implements curbs on exports of natural graphite under “national security” concerns. Kasiya is one of the world’s largest natural graphite deposits outside of China and has the potential to become a key source of strategic supply to the US, UK, EU, Japan and South Korea. According to industry experts Benchmark Mineral Intelligence, China currently produces 61% of all flake graphite used in the production of lithium-ion battery anodes and accounts for 93% of all graphite anode production globally.
Classification: 3.1 Additional regulated information required to be disclosed under the laws of a Member State
ENQUIRIES
|
Frank Eagar (South Africa/Malawi) +61(8) 9322 6322 |
Sam Cordin (Perth) |
Sapan Ghai (London) |
|
Nominated Adviser on AIM and Joint Broker |
|
|
SP Angel Corporate Finance LLP |
+44 20 3470 0470 |
|
Ewan Leggat Charlie Bouverat Harry Davies-Ball |
|
|
|
|
|
Joint Brokers |
|
|
Berenberg |
+44 20 3207 7800 |
|
Matthew Armitt |
|
|
Jennifer Lee |
|
|
|
|
|
Tavistock PR |
+44 20 7920 3150 |
The recently released PFS confirmed Kasiya as a potential major critical minerals project with an extremely low CO2-footprint delivering significant long-term volumes of natural rutile (the highest-grade, purest, natural titanium feedstock) and graphite (a key component of an electric vehicle battery) while generating significant economic returns. Both titanium and natural graphite are critical to several of the world’s economies as well as crucial to decarbonisation solutions required to meet “Net-Zero” and other targets set by policymakers.
BULK SAMPLING PROGRAM
The mechanised drill program will use a custom-made 300mm diameter spiral auger to extract over 100 tonnes of material from across Kasiya’s planned future pits with sampling to a maximum 20m depth (Figure 1).
The sampling program forms part of the Company’s program for graphite qualification, downstream testwork and product development, and is designed to produce over 1,000kg each of flake graphite and natural rutile products.
The bulk sample will be processed at the Company’s laboratory in Lilongwe, Malawi. This will be achieved with the newly installed Kwatani 30-inch single and double-deck vibrating separators for sizing and de-sliming (Figure 2). The sand fraction will then be processed over the new Holman Wilfley 2000 wet shaking table to produce a graphite pre-concentrate and a separate heavy mineral concentrate (HMC) containing the rutile (Figure 3). The graphite pre-concentrate is expected to grade 4-5% Ct whilst the HMC is expected to grade ~30% contained rutile.


Figure 1. Mechanised drill with custom-made 300mm diameter spiral auger


Figure 2. Installation of the new Kwatani 30-inch single-deck and double-deck vibrating separators for sizing and de-sliming bulk samples at the Company’s Malawi laboratory and metallurgical facility

Figure 3: Holman-Wilfley 2000 Series shaking table to be installed at Sovereign’s Lilongwe laboratory in Malawi.
Final processing will then be completed at commercial metallurgical laboratories in Canada and Australia. The graphite pre-concentrate will undergo traditional flotation and polishing processes to target >96% Ct product for lithium-ion battery anode feedstock. The HMC will undergo gravity spiral cleaner stages followed by electrostatic and magnetic separation stages to produce a +95% TiO2 natural rutile products.
PLANNED DOWNSTREAM TESTWORK
The 1,000kg of flake graphite product produced will be used for downstream test-work and initial product qualification targeting the battery anode sector. Previously reported initial characterisation testwork on Kasiya’s graphite has indicated excellent suitability for use in lithium-ion batteries with very high purity and very high crystallinity being the key features.
Downstream test-work and qualification on the 1,000kg flake graphite product produced will involve the following stages to be completed at recognised international battery sector laboratories;
– Purification via an optimised HF-free reagent scheme to >99.95% Ct
– Micronisation
– Spheronisation
– Carbon coating
– Anode production
– Electrochemical characterisation
Raw flake graphite products plus final CSPG (coated spheronised graphite product) will be provided to potential offtakers for assessment and pre-qualification. Through Sovereign’s well-established experience in graphite, the Company has built a strong understanding of the product’s market and developed relationships with well-established offtakers and customers.
A major component to graphite sales agreements is customer qualification, and this is a key reason for initiating the graphite bulk sample program and scaling up in-country facilities in order to continuously produce bulk samples. The graphite produced from this program will be shared with prospective end-users and is an important next step for Sovereign to qualify the Kasiya graphite product.
Sovereign’s recent initial graphite characterisation testwork conducted by an independent German industrial minerals specialist demonstrated superior qualities and excellent suitability for its use in lithium-ion batteries. Further downstream testwork is planned that will use the graphite concentrate produced from this current bulk sampling program.

Figures 4 & 5: SEM micrograph of Kasiya graphite flotation concentrate from previous testwork
INDUSTRY DEVELOPMENTS
On 20 October 2023, Reuters reported, effective 1 December 2023, that China would require export permits for some graphite products including natural graphite and natural graphite products critical to EV production. China is the world’s top graphite producer and exporter and also refines more than 90% of the world’s graphite into the material that is used in virtually all EV battery anodes.
China’s commerce ministry said the move on graphite was “conducive to ensuring the security and stability of the global supply chain and industrial chain, and conducive to better safeguarding national security and interests”.
Competent Person Statement
The information in this announcement that relates to Production Targets, Ore Reserves, Processing, Infrastructure and Capital Operating Costs, Metallurgy (rutile and graphite) is extracted from an announcement dated 28 September 2023 entitled ‘Kasiya Pre-Feasibility Study Results’ which is available to view at www.sovereignmetals.com.au. Sovereign confirms that: a) it is not aware of any new information or data that materially affects the information included in the original announcement; b) all material assumptions and technical parameters underpinning the Production Target, and related forecast financial information derived from the Production Target included in the original announcement continue to apply and have not materially changed; and c) the form and context in which the relevant Competent Persons’ findings are presented in this presentation have not been materially modified from the Announcement.
Forward Looking Statement
This release may include forward-looking statements, which may be identified by words such as “expects”, “anticipates”, “believes”, “projects”, “plans”, and similar expressions. These forward-looking statements are based on Sovereign’s expectations and beliefs concerning future events. Forward looking statements are necessarily subject to risks, uncertainties and other factors, many of which are outside the control of Sovereign, which could cause actual results to differ materially from such statements. There can be no assurance that forward-looking statements will prove to be correct. Sovereign makes no undertaking to subsequently update or revise the forward-looking statements made in this release, to reflect the circumstances or events after the date of that release.